-
질문 & 답변
카테고리
-
세부 분야
데이터 분석
-
해결 여부
미해결
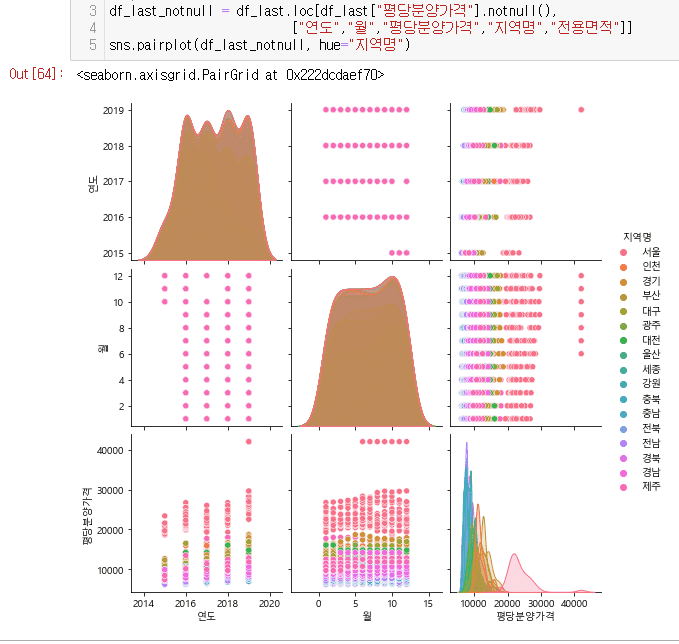
출력된 데이터 그래프 모양이 조금 다릅니다.
20.11.05 10:19 작성 조회수 317
3

안녕하세요 위와 같이 코딩을 하였는데 첫번째와 가운데 그래프는 선생님의 그래프와 다른 형태로 출력이 됩니다. 왜 그런걸까요??
답변을 작성해보세요.
1

yoon0420
질문자2020.11.06
이해하기 쉽게 설명해주셔서 감사합니다. 그럼 제가 사용하고 있는 seaborn이 어떤 버전인지 확인 및 업그레이드 하는 방법은 어떻게 되나요?
0
박조은
지식공유자2020.11.06
seaborn 을 sns로 불러왔다면 sns.__version__ 으로 설치된 버전을 확인해 보실 수 있습니다.
conda update seaborn 으로 아나콘다 프롬프트를 통해 업데이트 하실 수 있습니다.
아래의 문서를 좀 더 참고해 보세요.
[Installing and getting started — seaborn 0.11.0 documentation](https://seaborn.pydata.org/installing.html)
0
박조은
지식공유자2020.11.05
안녕하세요.
대각선에 그려지는 그래프는 kdeplot 이라는 그래프 입니다.
kdeplot은 히스토그램의 밀도를 추정해서 그리는 그래프 입니다.
그래서 확률밀도함수, 확률밀도곡선이라 부르기도 합니다.
이 때, 히스토그램의 밀도를 추정하게 되는데 같은 데이터셋으로 그렸다고 가정하면 밀도를 추정하는 bandwith 값을 지정하게 됩니다.
bandwith를 bw로 사용하게 되는데 스트링, 숫자로 지정할 수 있습니다. 보통은 숫자로 지정합니다.
이 값이 seaborn 의 버전마다 약간씩 차이가 있습니다. 아래 내용은 seaborn의 kdeplot 공식문서의 내용입니다.
bw : str, number, or callable
    Smoothing parameter.

    .. deprecated:: 0.11.0
       see ``bw_method`` and ``bw_adjust``.
공식문서에서도 kdeplot에서 주의해야 할 사항으로 bandwith에 대한 내용을 담고 있습니다.
Notes
-----

The *bandwidth*, or standard deviation of the smoothing kernel, is an
important parameter. Misspecification of the bandwidth can produce a
distorted representation of the data. Much like the choice of bin width in a
histogram, an over-smoothed curve can erase true features of a
distribution, while an under-smoothed curve can create false features out of
random variability. The rule-of-thumb that sets the default bandwidth works
best when the true distribution is smooth, unimodal, and roughly bell-shaped.
It is always a good idea to check the default behavior by using ``bw_adjust``
to increase or decrease the amount of smoothing.

Because the smoothing algorithm uses a Gaussian kernel, the estimated density
curve can extend to values that do not make sense for a particular dataset.
For example, the curve may be drawn over negative values when smoothing data
that are naturally positive. The ``cut`` and ``clip`` parameters can be used
to control the extent of the curve, but datasets that have many observations
close to a natural boundary may be better served by a different visualization
method.

Similar considerations apply when a dataset is naturally discrete or "spiky"
(containing many repeated observations of the same value). Kernel density
estimation will always produce a smooth curve, which would be misleading
in these situations.

The units on the density axis are a common source of confusion. While kernel
density estimation produces a probability distribution, the height of the curve
at each point gives a density, not a probability. A probability can be obtained
only by integrating the density across a range. The curve is normalized so
that the integral over all possible values is 1, meaning that the scale of
the density axis depends on the data values.
위 문서를 그대로 구글 번역기로 돌려봤습니다.
---------------------------구글 번역기 번역 내용 시작----------------------------------------
* 대역폭 * 또는 평활화 커널의 표준 편차는 중요한 매개 변수. 대역폭을 잘못 지정하면 데이터의 왜곡 된 표현. 빈 너비를 선택하는 것과 비슷합니다.
히스토그램, 과도하게 평활화 된 곡선은 곡선이 부드러워지면 잘못된 기능이 생성 될 수 있습니다.
무작위 가변성. 기본 대역폭을 설정하는 경험적 규칙이 작동합니다.
진정한 분포가 매끄럽고 단봉 적이며 대략 종 모양 일 때 가장 좋습니다.
항상``bw_adjust``를 사용하여 기본 동작을 확인하는 것이 좋습니다.
스무딩 양을 늘리거나 줄입니다.
평활 알고리즘은 가우스 커널을 사용하기 때문에 추정 된 밀도는 곡선은 특정 데이터 세트에 적합하지 않은 값으로 확장 될 수 있습니다.
예를 들어, 데이터를 평활화 할 때 음수 값 위에 곡선을 그릴 수 있습니다.
그것은 자연스럽게 긍정적입니다. ``cut ''및``clip ''매개 변수를 사용할 수 있습니다.
곡선의 범위를 제어하지만 많은 관측치가있는 데이터 세트 자연 경계에 가까울수록 다른 시각화가 더 잘 제공 될 수 있습니다.
방법.
데이터 세트가 자연적으로 불연속 적이거나 "뾰족한"경우 유사한 고려 사항이 적용됩니다.
(동일한 값에 대한 많은 반복 관찰 포함). 커널 밀도 추정은 항상 부드러운 곡선을 생성하므로 오해의 소지가 있습니다.
이러한 상황에서. 밀도 축의 단위는 일반적인 혼동의 원인입니다. 커널 동안 밀도 추정은 곡선의 높이 인 확률 분포를 생성합니다.
각 지점에서 확률이 아닌 밀도를 제공합니다. 확률을 얻을 수 있습니다
범위 전체에 걸쳐 밀도를 통합해야합니다. 곡선이 정규화되어 가능한 모든 값에 대한 적분은 1입니다. 즉, 밀도 축은 데이터 값에 따라 다릅니다.
---------------------------구글 번역기 번역 내용 끝----------------------------------------
이 내용을 이해할때 히스토그램의 bin의 갯수를 떠올려 보시면 좋습니다.
bin 의 갯수에 따라 히스토그램의 모양이 조금씩 달라지듯이 kdeplot로 밀도를 추정할 때 bw 값에 따라 달라지게 됩니다.
=> 질문 주신 내용에서 수업 내용과 같은 데이터로 같은 방법으로 그렸는데 다르게 보인다면 seaborn 의 bw 값 옵션이 달라서 다르게 보여지는 것입니다.


답변 3