
-
질문 & 답변
카테고리
-
세부 분야
데브옵스 · 인프라
-
해결 여부
미해결
프로메테우스
22.04.17 15:02 작성 조회수 466
0
답변을 작성해보세요.
0

gasbugs
2022.04.18
lin7258
질문자2022.04.23
강사님.. 너무 어렵습니다 ㅜㅋㅋㅋㅋㅋ
사실 지금 쿠버네티스 클러스터에 올린 것이 아니라 미니큐브 인스턴스에 프로메테우스와 그라파나를 올린 상황입니다.
그래서 다른 mongodb 인스턴스를 모니터링하고, alert manager로 슬랙 알림을 주고 싶습니다.
깃허브에 있는 prometheus의 values.yaml 파일을 참고하여 강사님께서 작성하신 values-prometheus.yaml 파일을
아래와 같이 수정하였습니다.
cat <<EOF > values-prometheus.yaml

alertmanager: # 30~33
  enabled: true
  persistentVolume:
    ## If true, alertmanager will create/use a Persistent Volume Claim
    ## If false, use emptyDir
    enabled: true
    accessModes:
      - ReadWriteOnce
    size: 2Gi
    replicaCount: 1
  service:
    type: LoadBalancer

## alertmanager ConfigMap entries # 1360
alertmanagerFiles:
  alertmanager.yml:
    global:
       resolve_timeout: 5m
       slack_api_url: 'https://hooks.slack.com/services/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'
    route:
      group_by: ['monitoring']
      group_wait: 30s
      repeat_interval: 1h
      receiver: default-receiver
      routes:
      - match:
          alertname: DeadMansSwitch
        receiver: 'null'
      - match:
        receiver: 'slack'
        continue: true
    receivers:
    - name: 'null'
    - name: 'slack'
      slack_configs:
       - channel: 'test'
         username: 'prometheus'
         send_resolved: true
         icon_url: https://avatars3.githubusercontent.com/u/3380462
         title: |-
          [{{ .Status | toUpper }}{{ if eq .Status "firing" }}:{{ .Alerts.Firing | len }}{{ end }}] {{ .CommonLabels.alertname }} for {{ .CommonLabels.job }}
         text: >-
            {{ range .Alerts -}}
            *Alert:* {{ .Annotations.title }}{{ if .Labels.severity }} - {{ end }}

            *Description:* {{ .Annotations.description }}

            *Details:*
              {{ range .Labels.SortedPairs }} • *{{ .Name }}:*
              {{ end }}
            {{ end }}

server:
  enabled: true

  persistentVolume:
    enabled: true
    accessModes:
      - ReadWriteOnce
    mountPath: /data
    size: 100Gi
  replicaCount: 1

  ## Prometheus data retention period (default if not specified is 15 days)
  retention: "15d"  # 15일간 데이터를 보존함

serverFiles:
  alerting_rules.yml:
    groups:
    - name: example
      rules:
      - alert: HighRequestLatency
        expr: sum(rate(container_network_receive_bytes_total{namespace="kube-logging"}[5m]))>20000
        for: 1m
        labels:
          severity: page
        annotations:
          summary: High request latency

  prometheus.yml:
    rule_files:
      - /etc/config/alerting_rules.yml
      - /etc/config/alerts

EOF
helm install 하였더니 alertmanager 파드에서 Crash Loop BackOff 오류가 납니다... 이미지가 이미 존재한다는데 어떻게 해야 할지 모르겠습니다.

2.
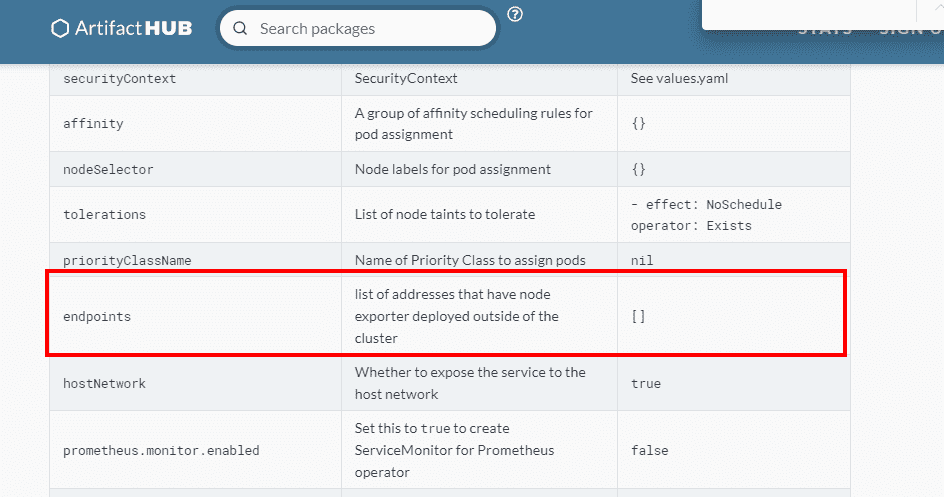
그리고 몽고디비를 타겟으로 설정하기 위해 깃허브에 있던 mongodb-exporter.yaml 파일을 가져와
cat <<EOF > mongodb.yaml
mongodb:
  uri: "mongodb://mongodb0.example.com:27017"
existingSecret:
  name: "MONGO_INITDB_ROOT_PASSWORD"
  key: "secret"
port: "80"

readinessProbe:
  httpGet:
    path: /
    port: metrics
  initialDelaySeconds: 10

metrics:
  enabled: true

	serviceMonitor:
	  enabled: true
	  interval: 30s
	  scrapeTimeout: 10s
	  namespace:
	  additionalLabels: {}
	  targetLabels: []
	  metricRelabelings: []

EOF
라고 저장 후
helm install mongodb prometheus-community/prometheus-mongodb-exporter -f mongodb.yaml -n prometheus 해주었는데 이렇게 하는 게 맞을까요?
질문이 두서없고 정신이 없네요...
늘 감사합니다.
gasbugs
2022.04.25
안녕하세요 강사 최일선입니다.
개인 프로젝트에 관련해서는 테스트 해보고 말씀 드려야해서 시간이 다소 소요됩니다.
테스트하고 추가 답변 드리겠습니다. 감사합니다.

답변 1