-
질문 & 답변
카테고리
-
세부 분야
데이터 분석
-
해결 여부
미해결
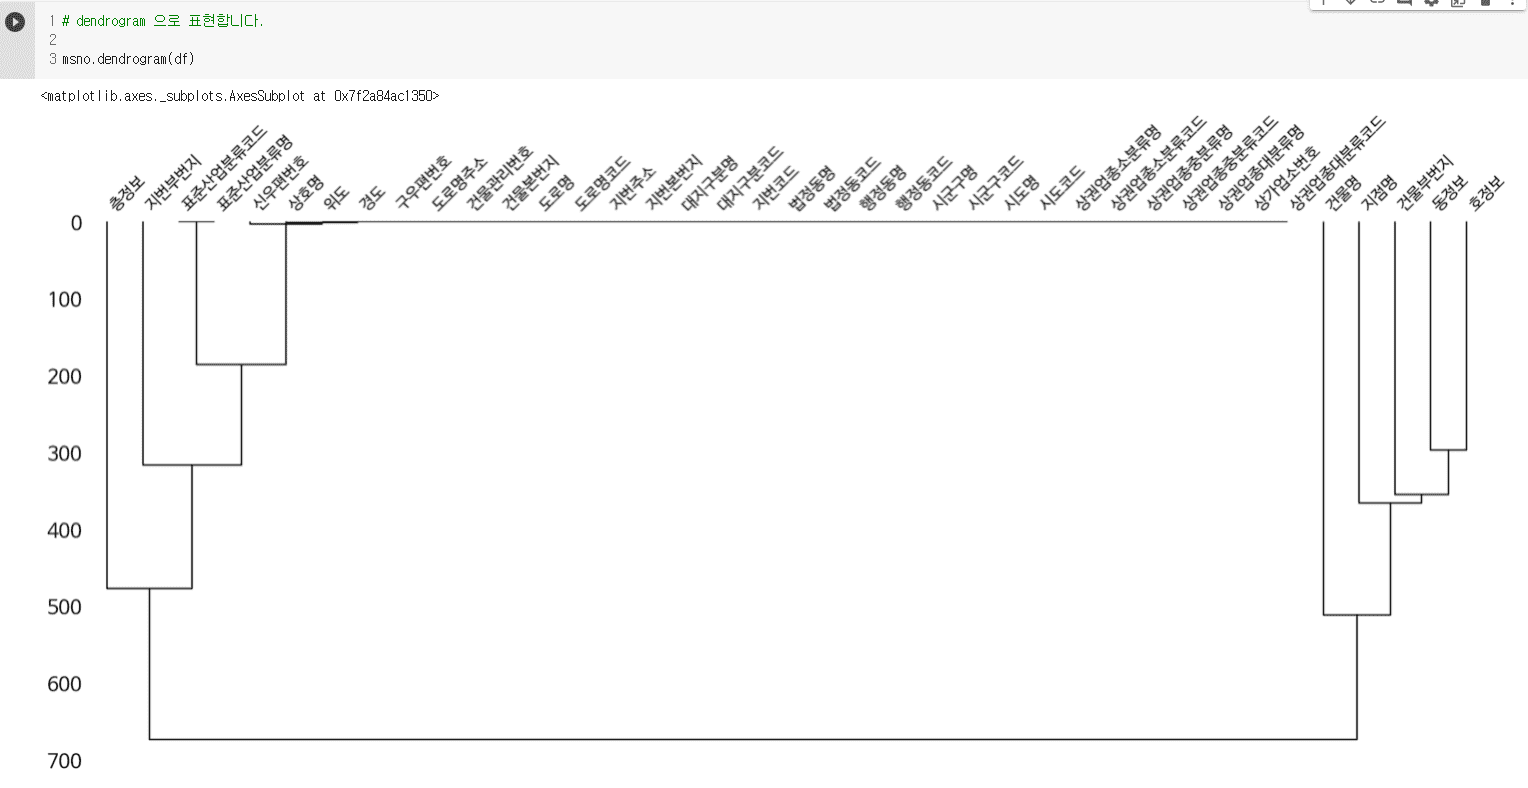
msno.dendrogram()
21.08.30 17:02 작성 조회수 254
1
안녕하세요 선생님
해당 코드로 dendrogram을 그리면 df의 결측 데이터로 그리는 건가요? 그냥 df 데이터로 그리는 건가요?
답변을 작성해보세요.
0
박조은
지식공유자2021.08.31
안녕하세요!
missingno 는 결측치를 시각화 하는 도구입니다. 질문 주신 내용도 결측치로 그리게 됩니다.
아래 질문주신 내용에 대한 공식 문서 내용이 있으니 참고해 보세요!
출처 : https://github.com/ResidentMario/missingno
dendrogram
The dendrogram allows you to more fully correlate variable completion, revealing trends deeper than the pairwise ones visible in the correlation heatmap:
msno.dendrogram(collisions)
The dendrogram uses a hierarchical clustering algorithm (courtesy of scipy) to bin variables against one another by their nullity correlation (measured in terms of binary distance). At each step of the tree the variables are split up based on which combination minimizes the distance of the remaining clusters. The more monotone the set of variables, the closer their total distance is to zero, and the closer their average distance (the y-axis) is to zero.
To interpret this graph, read it from a top-down perspective. Cluster leaves which linked together at a distance of zero fully predict one another's presence—one variable might always be empty when another is filled, or they might always both be filled or both empty, and so on. In this specific example the dendrogram glues together the variables which are required and therefore present in every record.
Cluster leaves which split close to zero, but not at it, predict one another very well, but still imperfectly. If your own interpretation of the dataset is that these columns actually are or ought to be match each other in nullity (for example, as CONTRIBUTING FACTOR VEHICLE 2 and VEHICLE TYPE CODE 2 ought to), then the height of the cluster leaf tells you, in absolute terms, how often the records are "mismatched" or incorrectly filed—that is, how many values you would have to fill in or drop, if you are so inclined.
As with matrix, only up to 50 labeled columns will comfortably display in this configuration. However the dendrogram more elegantly handles extremely large datasets by simply flipping to a horizontal configuration.


답변 1