GPT Instructor’s Regular Course · Competitor Comparison Table × DART Filings
I asked AI to create a comparison table for five cosmetics companies.
The revenue and operating profit figures were right,
but the table columns were misaligned.
Amorepacific · LG Household & Health Care · APR · Dalba Global · Clio. The “Cosmetics Revenue” and “Overseas Revenue Share” columns didn’t line up. The AI hadn’t made up the numbers; each company was using the same terms to mean different things.
15 lessons + 1 mission · 25 min 44 sec
Preview the first 3 lessons
Prompt pack PDF · comparison kit Excel · free online practice room
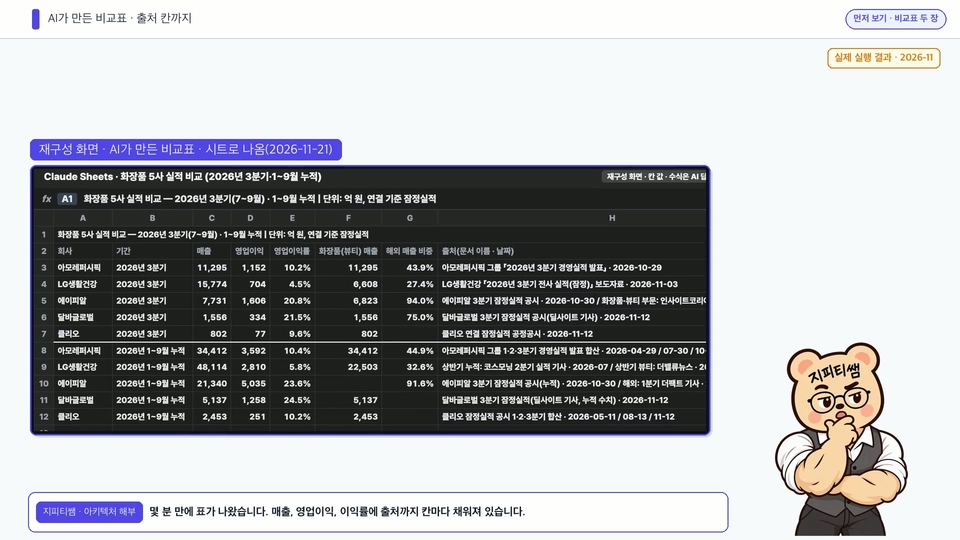
A comparison table created by AI in just a few minutes—even the source column was filled in.
This is a table Claude made from the same four-line request. Revenue and operating profit matched the published figures. The problem was the columns with the same names but different definitions.
Lesson 1 screen · Comparison table created by AI (reconstructed from actual results run in November 2026).
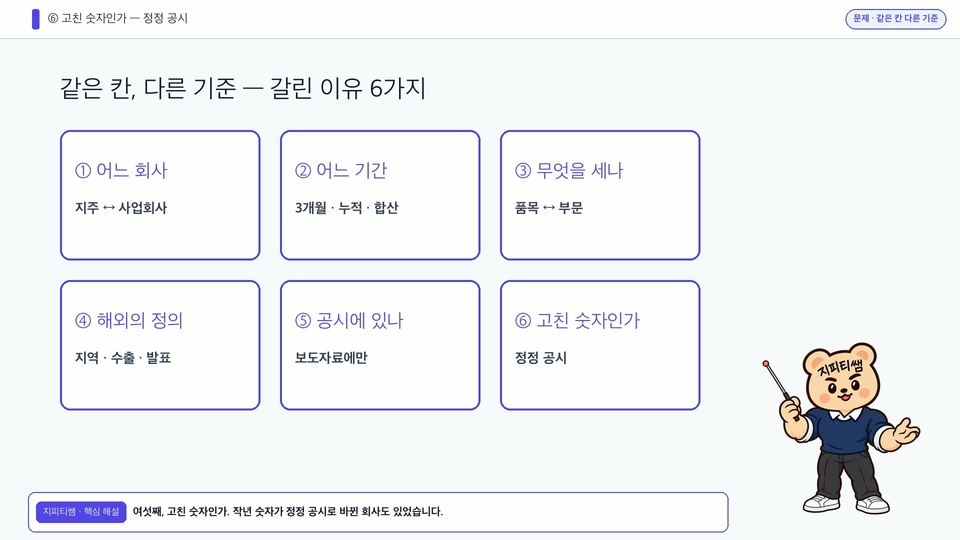
The Same Field, Different Criteria—Six Reasons for the Discrepancy
Lesson 2 screen · Before looking for the numbers, set these six criteria for each cell.
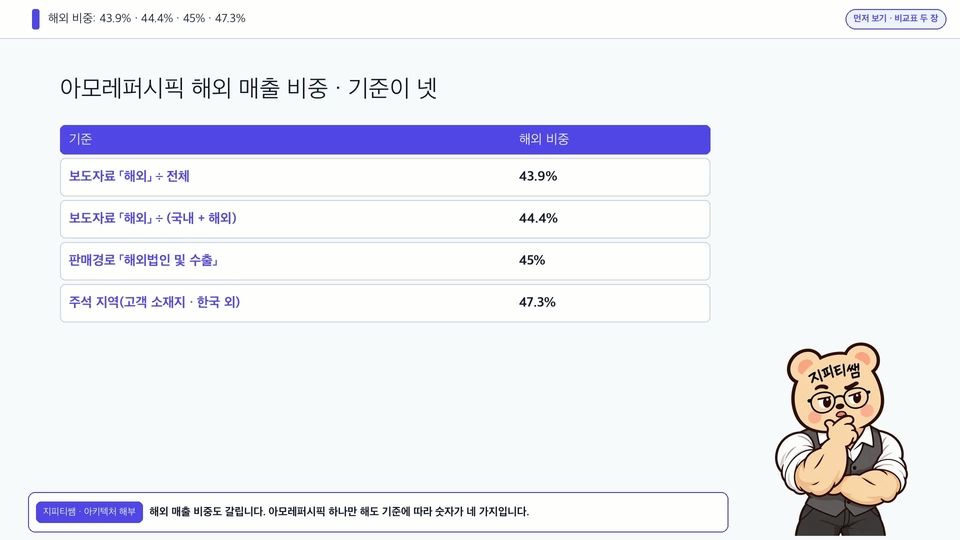
Amorepacific’s Overseas Share
Depending on the criteria: 43.9%, 44.4%, 45%, and 47.3%—four different figures.
APR “Cosmetics”
Product category · segment · article, three figures · segment revenue exceeds total company revenue
D'Alba Global's corrected disclosure
Last year’s figures were corrected · AI suspected an accurate article
Four different figures for the same company
Lecture 1 slide · Depending on what counts as “overseas,” the same company’s overseas share comes out to four different figures.
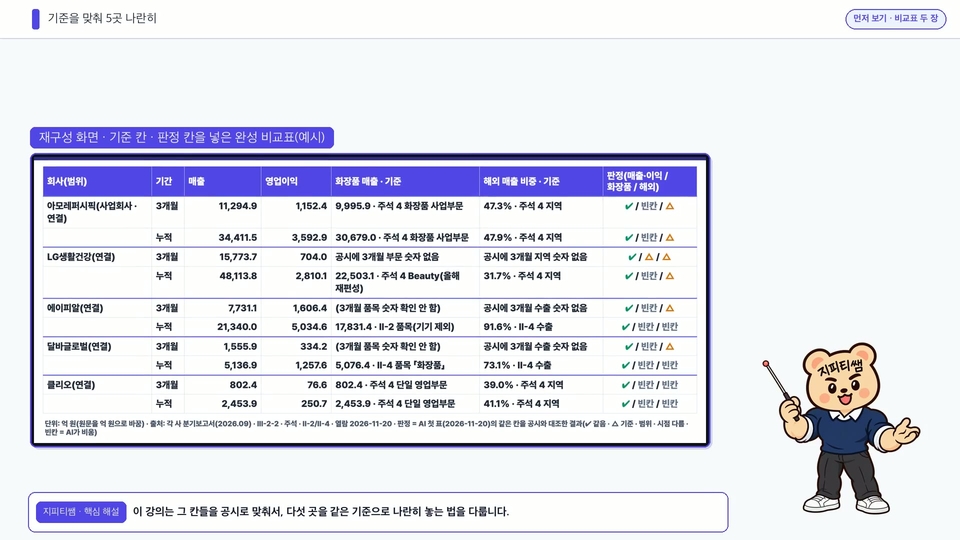
When the criteria are aligned, all five stand side by side.
This is a completed comparison table that transcribes figures from three sections of the DART quarterly report (Q3 2026) and assigns a criterion and ✔ · △ · ✖ rating to each cell. All reported figures are reproduced exactly from the original DART filing (viewed on 2026-11-20).
Lesson 1 Screen · Follow the steps for creating this table over 15 lessons.
Choose the verdict yourself
In the free online practice lab, “AI Comparison Table Cells vs. Disclosures,” which you can use without logging in, look at the AI and disclosure values and choose ✔ · △ · ✖. The answer and explanation will appear after you choose. Enter your industry and company name to generate a cell-by-cell table prompt (①), too.
Open the free web practice lab “AI Comparison Table Cells vs. Disclosures” →
Curriculum
| Section 1 · Preview — The Finished Product and the Problem |
| 1 | [See the Finished Product First] Comparison Table of 5 Cosmetics Companies — AI-Generated Table vs. Table Aligned with Disclosures Preview |
| 2 | [Problem] The numbers were right, but the table didn’t match — six cases where the same column used different criteria Preview |
| 3 | [Solution] Start with the basis for each cell, not the numbers — Free Prompt ① Preview |
| Section 2 · Aligning the Basis |
| 4 | [Solution] Three places to look in DART quarterly reports |
| 5 | [Sticking Point] Three Months or Cumulative?—Adding the Quarters Leaves a 100 Million Won Discrepancy |
| 6 | [Pitfall] Numbers not in the filings — add source labels to press release figures |
| 7 | [Solution] Add a ✔ · △ · ✖ verdict column to the comparison table. |
| Section 3 · Hands-on Practice with 5 Companies — One Pitfall per Company |
| 8 | [Where It Gets Tricky] Amorepacific — Which Company’s Numbers Are These? Does “Cosmetics” Mean Total Company Revenue? |
| 9 | [Tricky] LG Household & Health Care — the year the segments were reorganized, the quarter missing from the company’s data |
| 10 | [Trap] APR — the same “cosmetics,” three different figures |
| 11 | [Stuck] Dalba Global — A corrected disclosure: the article was right, and the AI’s suspicion was wrong |
| 12 | [Resolved] Clio — A company with no segments; the missing details are in the notes. |
| Section 4 · Reporting and Updating |
| 13 | [Solution] Turn the Comparison Table into a One-Page Report — Fact Columns and Interpretation Columns |
| 14 | [Solution] Next Quarter — Five Steps to Update Only the Changed Fields |
| 15 | [Proposal] Adapt It to Your Industry · What Not to Leave to AI · Organize Your Prompts |
| Mission | Aligning Benchmarks with Public Disclosures: 3 Questions |
Suitable for the following people:
✔ Planning, strategy, marketing, and sales professionals who regularly report on competitors and industry trends
✔ Those who are unsure whether it’s okay to include AI-generated comparison tables in reports as-is
✔ Anyone opening a DART filing for the first time
What’s included
📄 Prompt Pack PDF (3 pages, Lesson 3 materials) — Prompts ①–⑤ · Where to find the information in DART · Quarterly update checklist
📊 Comparison Kit Excel Spreadsheet (Lesson 4 Materials) — Table Template · Examples from 5 Sources · One-Page Report Template · Update Checklist
🧮 Free Web Workshop “AI Comparison Table Fields vs. Filings” — 9 Judgment Cards · Create a Prompt for Table Fields
What This Course Is Not
· This course does not recommend buying or selling any particular company. It does not provide investment or accounting advice.
· We do not evaluate whether a company is good or bad. We cover how to read and compare disclosures side by side.
· AI results may vary each time they are run. The AI screens shown in the course record one or two actual runs each in November 2026; they do not mean that “AI always gets it wrong like this.”
The lecture audio is synthesized using local Qwen3-TTS, and the cover image was created with an AI image generator.