Industry Mapping with Claude — Gathering 259 Companies in One Day and Correcting Incorrect Figures Using Public Disclosures
This is the actual process of having Claude divide the beauty-and-biotech sector into eight country-specific segments and assign one to each, creating an industry map of 259 companies in a single day. I then checked and corrected the inaccurate figures mixed into that map, one by one, against the original filings on Korea’s DART, the U.S. SEC EDGAR, Hong Kong’s HKEXnews, and the U.K.’s Companies House—and I’ll also provide the prompt for applying the same process to my own industry (figures as of October 14, 2026).
How to Write Research Instructions That First Define the “Table Fields (Schema)” to Be Filled Out Consistently by Multiple AIs, Then Divide the Work into Eight Country-Based Categories
For each number, indicate its source and timing, along with ✓(original disclosure) · △(reported · estimated) · ✖(claims that differ from the disclosure), and learn how to question the currency · unit · type of metric starting from the top of the rankings
How to find filings on Korea’s DART, the U.S. SEC EDGAR, Hong Kong’s HKEXnews, and the U.K.’s Companies House, then pass them to Claude for preliminary research and line-by-line comparison
How to Create a Filter Industry Map (a Single HTML File) That Opens on Your Computer Without a Server, and a “How Much Remains from Every $1 in Sales” Comparison Table for Your Industry
GPT Teacher’s AI Research Methods Series, Paid Course
After assigning the work to Claude, we gathered 259 companies in just one day. We opened the filings to correct inaccurate figures.
They say beauty and biotech are taking off together, but at first, I had no idea which companies were out there either. So I divided the work among Claudes by country and created an industry map of 259 companies, then checked and corrected the incorrect figures mixed into that map one by one using filings from Korea, the United States, Hong Kong, and the United Kingdom. I’ll show you that exact process. You don’t need any coding or financial knowledge.
4 sections, 17 lessons (approximately 32 minutes based on audio length)
The first three lessons in the first section are previews
13 copy-and-paste prompts and how to find filings from five countries
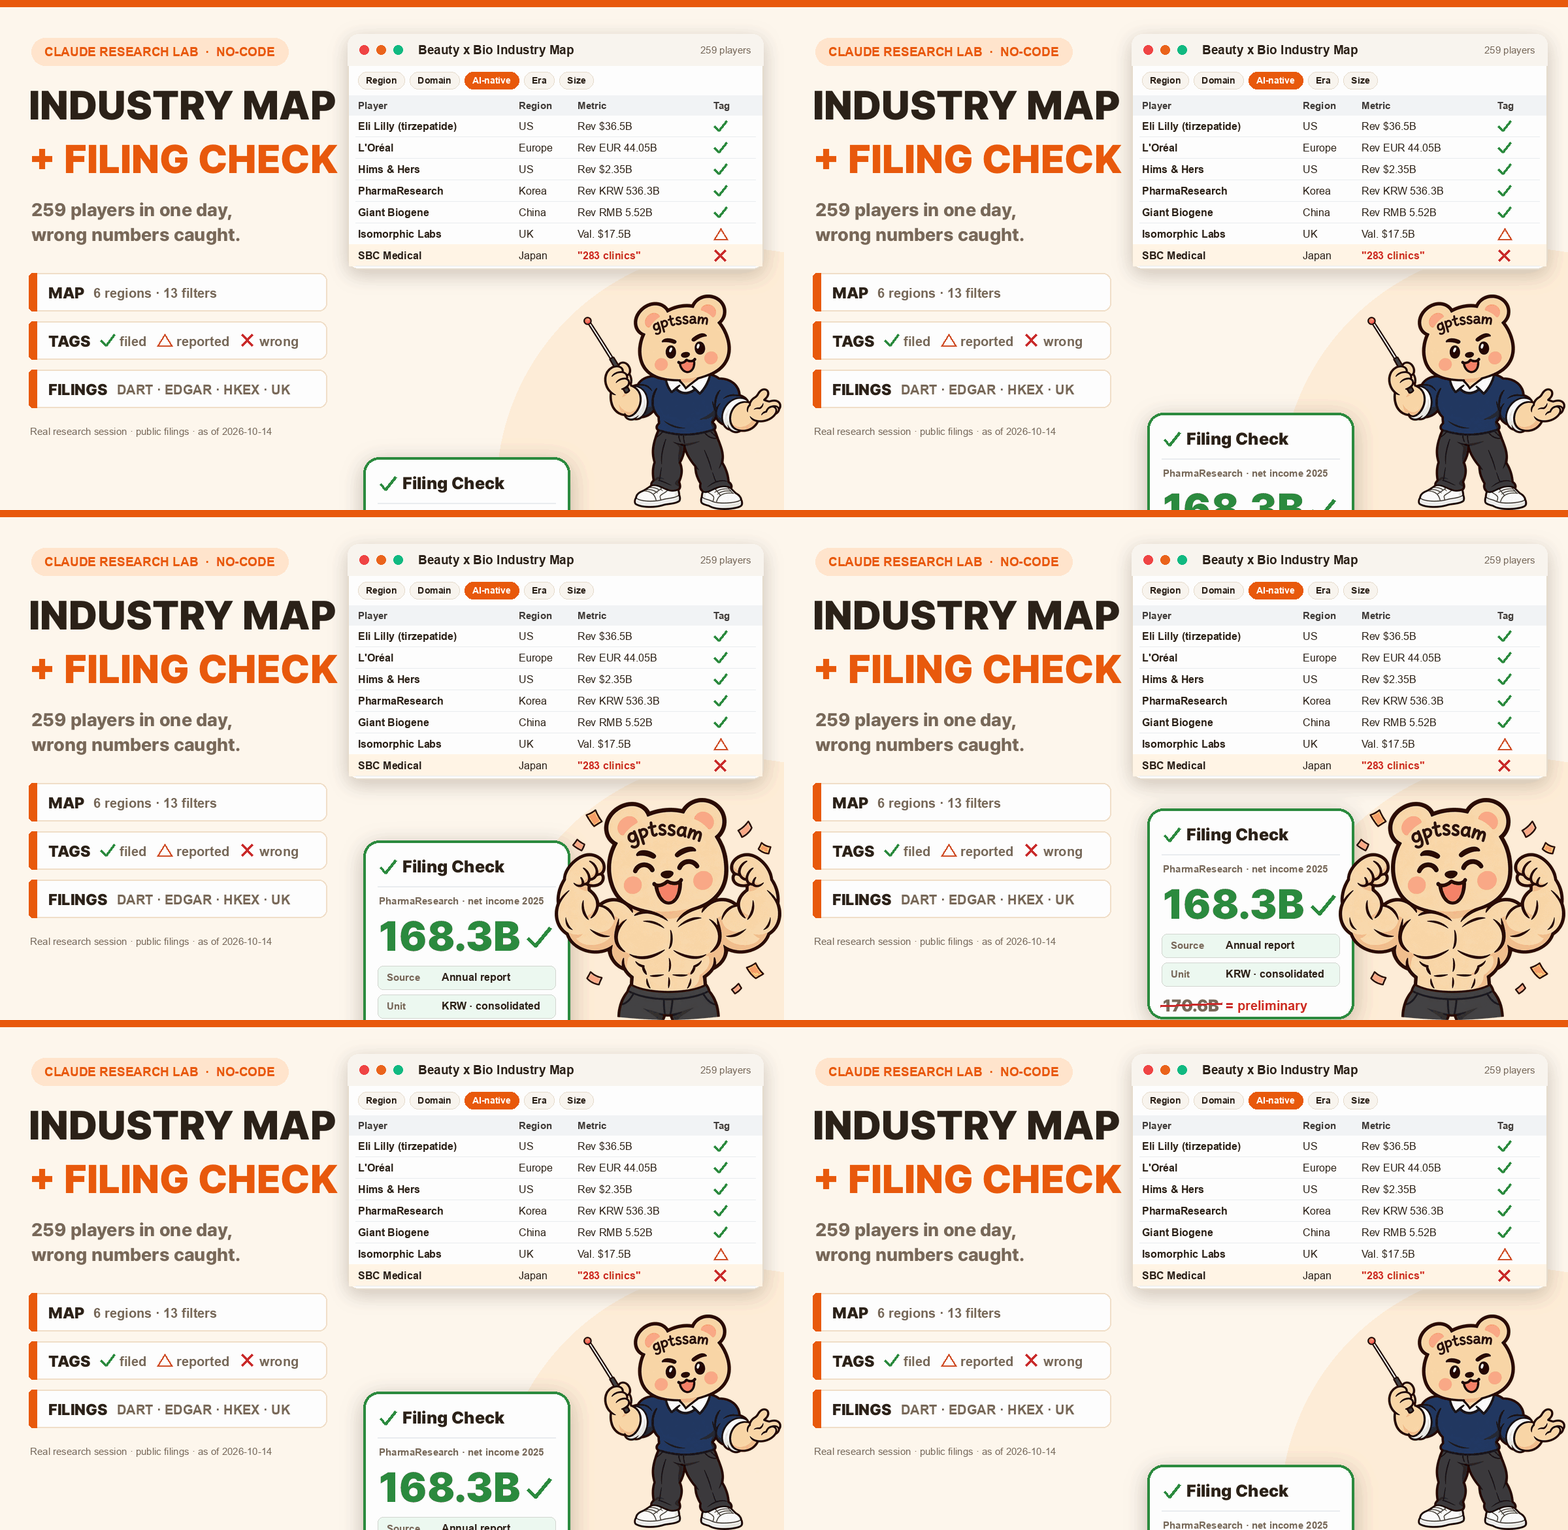
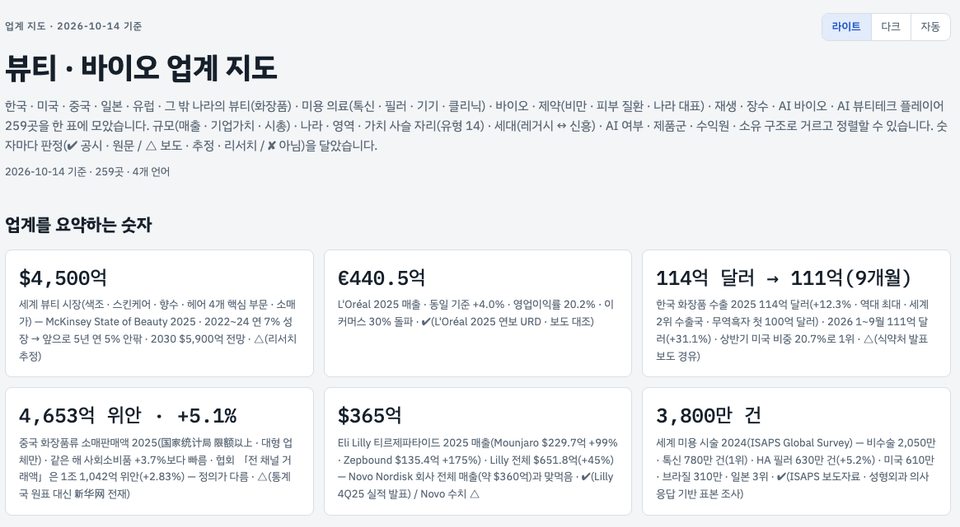
Let me show you the completed map first.
As of 2026-10-14. A total of 259 companies from Korea, the United States, China, Japan, Europe, and other countries are included in one table, with each number marked to indicate whether it has been verified through public disclosures.
The industry map’s opening screen. Filter by 13 criteria, such as country, sector, generation, and whether it is AI-related; sort them by size; and click a row to expand how they make money and their sources.
259 companies
A board where 6 regions and 5 sectors overlap
34 companies
Companies whose primary business is AI
✓ 119 companies △ 140 companies
Determining the representative figures. More than half were based on reports or estimates.
In the lecture, five companies were rechecked against their filings, while the rest remain as they were in the initial survey. That’s why we’ve attached a clear indication to every figure without hiding anything.
This is what was written in the initial AI research.
They sound plausible. I’ll show you exactly what happened when we opened the disclosures in the preview lesson, “This Is How AI Research Gets Things Wrong.”
Giant Biogene (China)
“It sells recombinant collagen ingredients to other companies and also sells its own brand.”
SBC Medical (Japan)
“Shonan Beauty has 283 franchised clinics.”
Isomorphic Labs (UK)
“Annual revenue is $155 million.” (Company information website)
Pharma Research (South Korea)
“Net profit for 2025 was 170.6 billion won.”
Hims & Hers (U.S.)
“Monthly revenue per subscriber fell from $84 to $74 because the partnership with Novo ended.”
The AI in charge of Europe
One line of warning appended to the end of the report, just before making the map.
What You Do in the Four Sections
Preview of the Finished Product and Problems
After reviewing the completed map and the six cases where the AI was wrong, first decide the fields in the table that multiple AIs will fill out identically (this time, 29 fields). We provide the prompt for creating the fields for free.
Gather Broadly
Decide what to count for size, divide the work among eight branches, mark each number with ✓ △ ✖, and create a single map file that can be filtered.
Verify through regulatory filings
Open the original documents for PharmaResearch on DART, Hims & Hers and SBC Medical on SEC EDGAR, 巨子生物 on HKEXnews, and Isomorphic Labs on Companies House, then cross-check them line by line through primary research.
Proposal
I line up five companies side by side by “how much is left from every $1 of revenue,” lay out the steps for adapting this to my industry, and explain what should not be entrusted to AI. The final section is a three-question review quiz.
Three places where copying gets you stuck
Snag ①
If eight AIs search simultaneously, they all use the same wallet. If the earlier branches use it all up, what will fill in the companies at the back?
Issue ②
When I combined the eight votes and ranked the first round, all four top entries were strange.
Issue ③
The clinic revenue total of $1.16 billion matched the public filings. But the share the company actually takes home was a separate matter.
What I Entrusted to Claude, What I Did Myself
I left the collecting and reading to Claude. A person chose what to count and performed the final verification.
work
What Claude did
What the human did
What to count
Organized the candidate metrics, along with which companies fit and do not fit each metric.
Asked, “What should we use to count the order of usage?” and decided to rank revenue and company value separately.
Broad collection
Simultaneous research across eight categories (5–11 minutes per category, approximately 122 searches in total)
Divide into categories and set a maximum number of searches for each category
Determine the filtering dimensions
Suggest filtering axes tailored to the question
“Should the old powers, rising players, and AI be considered separately?” question
Check public disclosures
Read tables in annual reports and scanned financial statement files, cross-checking each line against the primary research.
Check the original source directly at least once for any numbers used in the report.
Payment · Sign-up · Login
Not done
A person handles payment for paid materials and signing up for the site.
Takeaways
Within the Inflearn course
17 videos and 3 review quiz questions Free practice pack: 2 free prompts, a row schema template (29 fields), and a one-page industry summary Main course practice pack: the complete prompt pack (13 prompts), a guide to finding filings in 5 countries, and a template for calculating “How much remains from $1 in revenue?”
The practice pack is in the upper-right [Class Materials] section of the “Start with the Table Cells” lesson and the “Usage Order” lesson.
Hands-on in the web lab
Explore the industry map yourself “AI Research vs. Filings” quiz: Mark 10 initial research statements with ✓ △ ✖ to reveal the supporting filing evidence A prompt field that fills in when you enter an industry name A follow-along video showing how to run the prompt and open the filings An updated version revised after quarterly results are released
This is not investment advice. It does not tell you to buy or sell any particular company; it covers how to read disclosures.
We do not evaluate whether a company is good or bad. We only look at where money comes in and where it goes out.
I do not cover the effects of cosmetic procedures or medications. I only look at the company’s revenue structure.
All figures in the lecture are as of October 14, 2026. They will change when quarterly results are released.
No company logos or photos of people were used. The companies are depicted only with name boxes and tables, and only redacted copies were used for personal information shown on screen. The lecture audio is AI-generated voice (TTS).
함께 나누기
If you get stuck, ask like this.
The fastest way is to paste the confusing screen or disclosure table directly into Claude and ask first. If that still doesn't solve it, come to the Q&A board or open chatroom. Please also share the map you created for your industry.
Professionals who need to quickly understand a new industry (planning · marketing · sales · consulting)
A job seeker studying the industry they plan to apply to
A non-developer who wants to try using Claude as a research tool instead of a search bar
Need to know before starting?
No coding or financial knowledge required — proceed using copy-and-paste prompts.
Materials: Claude (used with web search enabled · the plan depends on the service’s policy). You can also paste this into ChatGPT or Gemini and use it in the same way.
I’m GPT Teacher, researching and building AI agent workflows and content automation systems.
After implementing and validating trending global AI technologies and workflows firsthand, I teach them so that even non-developers can reproduce the same setup on their own computers in just 10 minutes by sharing the execution logs, prompt specifications, and open-source starter kits as complete files. Instead of making exaggerated promises about views or revenue, I show you with data and code what actually worked and how it was validated.
[Key Research and Course Areas]
Building AI Agents & a Second Brain: Knowledge compilation and workflow automation based on Claude Code · Google Antigravity · Karpathy LLM Wiki
AI video and content production systems: Fact-checking and automated rendering pipelines combining Google Flow (Veo), TTS, and agents
Integrity verification automation: A lint pipeline that comprehensively checks broken links and factual accuracy across scripts, wikis, and data