I am teaching office certification courses to help students preparing for employment with their self-development.
And I teach practical Excel classes for office workers to help them improve their job competencies
CEO of Eunhee-ssam Class
■ Professional Qualifications
Vocational Training Teacher Level 2 (General Administration & Office Work) Ministry of Employment and Labor
Vocational Training Instructor (Information Technology Operation & Management) Level 3 Ministry of Employment and Labor
Vocational Training Teacher Level 3 (General Administrative Affairs) Ministry of Employment and Labor
Computer Literacy Level 1 Korea Chamber of Commerce and Industry
ITQ Professional Training Instructor (PTI) Korea Productivity Center
ITQ Hangul A, Excel A, PowerPoint A, Internet A Korea Productivity Center
Computer Utilization Ability Level 2 Korea Chamber of Commerce and Industry
Industrial Engineer Information Processing Human Resources Development Service of Korea
■ Publications
85 Excel Functions to Pick and Use Like a Dictionary & Everything About Analysis Tasks (Bookk 2020)
■ Teaching Experience
Taught OA and ITQ certification courses at the Daechi 4-dong Information Education Center in Gangnam-gu as a member of GIT Academy, commissioned by Gangnam-gu Office 2009.03
Lectured on OA and ITQ certifications for people with disabilities and seniors at Gunpo Welfare Center for the Disabled, March 2011
Conducted OA lectures at the Geumcheon-gu Office Computer Training Center as part of Hanbit Computing, entrusted by Geumcheon-gu Office, 2012.03
Taught OA and ITQ certification courses for people with disabilities and seniors at Seodaemun Welfare Center for the Disabled 2013.03
Taught Computer Literacy Level 2 and ITQ OA Master courses for office workers and the general public at the Hwaseong U&I Center (Women's Vision Center) 2015.01
Taught Computer Literacy Level 2 and ITQ OA Master courses as part of the vocational training program for the unemployed at the Gyeonggi Vocational Education Center, 2015.03
Lectured Computer Literacy Level 1 and 2, and ITQ OA Master courses as vocational training programs for the unemployed at Green Computer Academy 2016.04
Obtained "A" grade in Office Administration Trainee Evaluation, Dec 2018
Awarded Star Instructor at Green Computer Academy 2020.10
Selling practical Excel and certification courses on Inflearn 2022.03
[Teacher Eunhee's Class] Launch of an online lecture site specializing in employment certifications, September 2022
[Mapo Youth Naru] Youth Employment Competency ITQ Excel Special Lecture

.jpg?w=736)

![Do you want to quit your job? If so, you should take the [Excel Function Dictionary] course.Course Thumbnail](https://cdn.inflearn.com/public/courses/328591/cover/e6c500ab-3346-48df-84a8-b7c0876eea16/함수사전(인프런).jpg?w=420)
![[Pass the Level 2 Computer Utilization Skills Practical Test in 5 Days]Course Thumbnail](https://cdn.inflearn.com/public/courses/330613/cover/820dc36f-c51d-4917-9eab-2fa9d5a291e5/330613-eng.png?w=420)
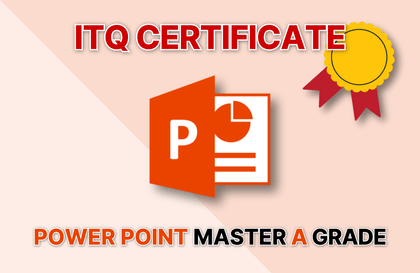
![[Pass ITQ PowerPoint A in One Go] in just 2 daysCourse Thumbnail](https://cdn.inflearn.com/public/courses/330108/cover/a0a7ac8c-cbd6-4acf-9cad-494ee28e1faf/파워포인트 썸네일(인프런).jpg?w=420)
![Just 2 days!! [Pass ITQ Korean A in one go]Course Thumbnail](https://cdn.inflearn.com/public/courses/330083/cover/776d0ef6-1cf9-40c6-bb01-969283a0ee5e/ITQ한글썸네일(인프런).jpg?w=420)
![[Pass ITQ Excel A in One Go] in 3 daysCourse Thumbnail](https://cdn.inflearn.com/public/courses/329652/cover/b44e11b6-a47e-4993-86ea-a85da9836bb5/329652-eng.png?w=420)
![[Useful Excel Tips to Know (1)] that will get you recognized by your bossCourse Thumbnail](https://cdn.inflearn.com/public/courses/329430/cover/2672867b-3832-4d62-b4e9-9904c723e7d0/엑셀팁(인프런).jpg?w=420)
![[Work Automation Using Free MS RPA] Power Automate Desktop - Excel AutomationCourse Thumbnail](https://cdn.inflearn.com/public/courses/330201/cover/8adc841c-39de-4770-98d3-2439ed8881a3/330201-eng.png?w=420)
![[Differentiation] Essential lecture on PPT productionCourse Thumbnail](https://cdn.inflearn.com/wp-content/uploads/ppt_differ.jpg?w=420)
![[Revised in 2024] This is the real Korean language automation [Basic Edition]Course Thumbnail](https://cdn.inflearn.com/public/courses/335093/cover/830eee3a-faa8-4d1b-be61-67bbbe75de9f/335093.png?w=420)