Learning Statistics with R
statisticsplaybook
For those of you who are having a hard time with college statistics, a senior who was in the same position will share his know-how. Conquering basic statistics using R programming
Beginner
Statistics, R
The logic behind basic statistical theory and statistical testing,
Understand while implementing it in Excel 🔦
Statistics classes in school are so hard to understand, aren't they? Especially the ones about tests, no matter how many times you hear about them, they're still confusing! The truth is, statistics is difficult because we lack a basic understanding of the underlying theories behind them. Once you understand the background of statistical tests and study them, nothing is more fun than statistics! :)
In this course, you'll learn the properties of basic statistical indicators , the laws of large numbers and the central limit theorem, fundamental statistical concepts , and establish a solid understanding of confidence intervals, statistical significance levels, and p-values . This course is filled with my teaching expertise, accumulated while teaching basic statistics to undergraduates at American universities. Statistics can be difficult, but we make it fun.
Unique features of this course 🪄

Someone who feels better when they implement something themselves

People who learn by giving specific examples when studying

Those who don't understand basic statistics and just memorize and solve problems

For those who want to know why they learn statistical theory
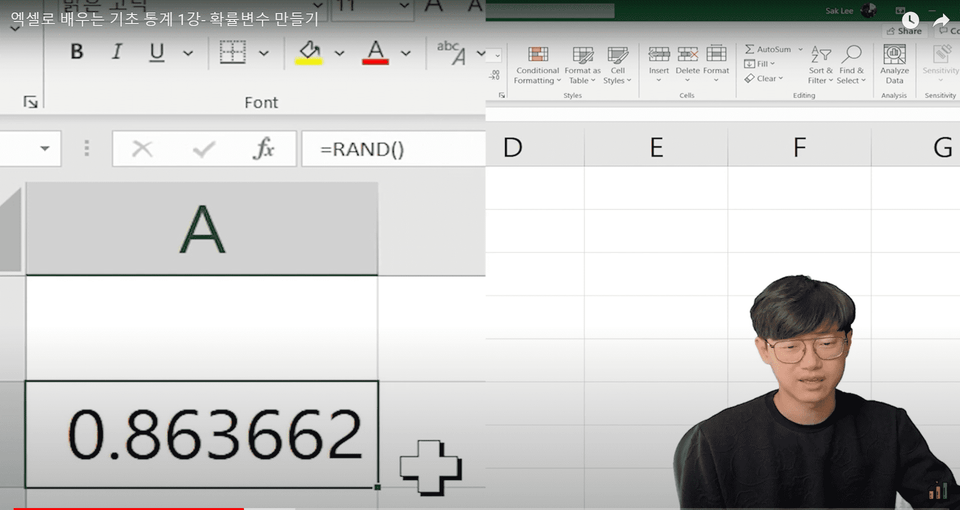
1) Random variables and samples
We'll create random variables ourselves and learn about their properties. This will establish concepts about random variables and sampling. We'll use the RAND() function to create virtual coins and learn about Bernoulli random variables.
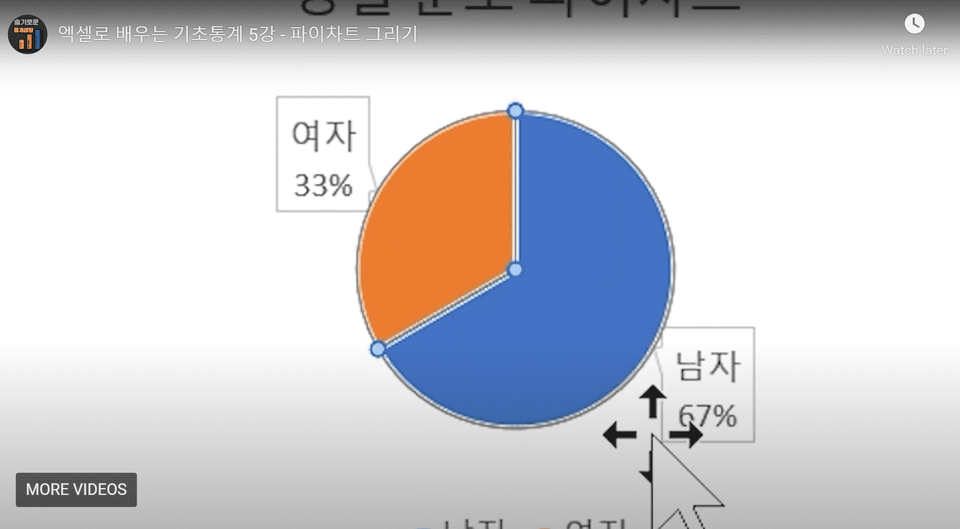
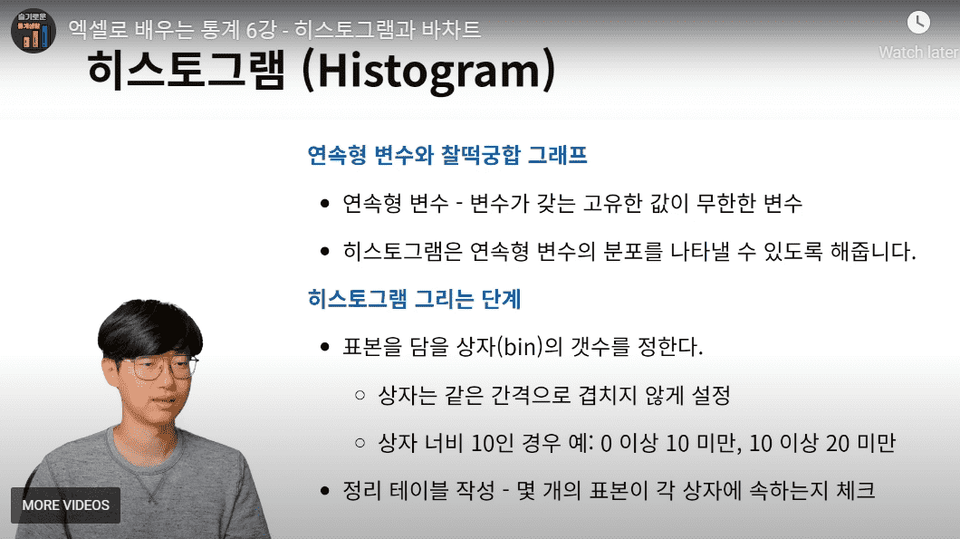
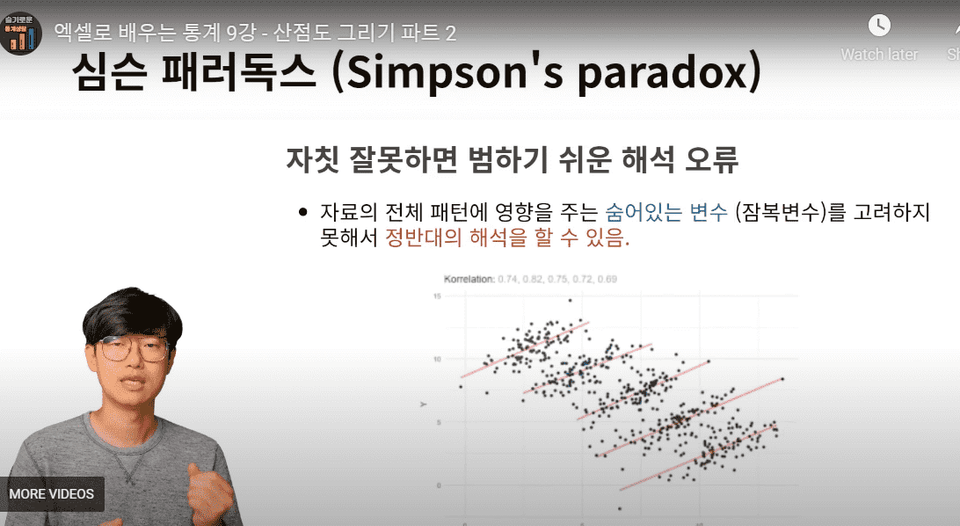
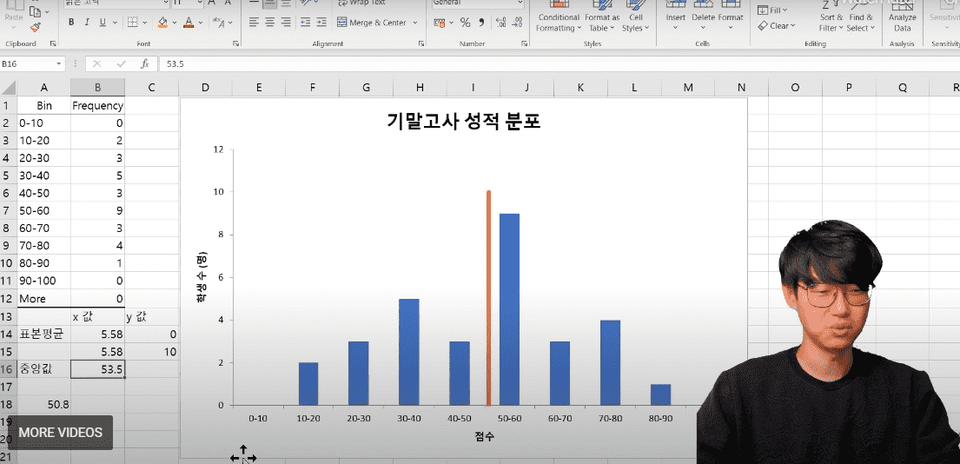
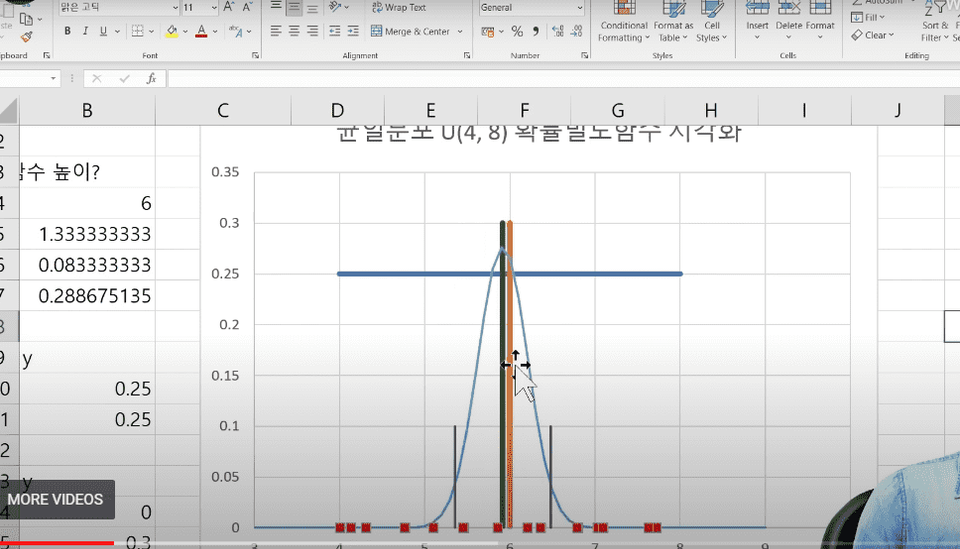
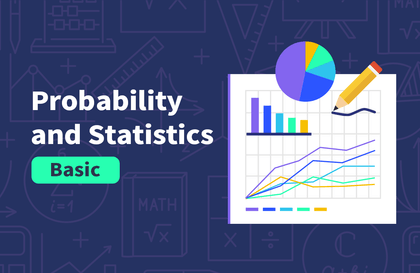
2) Data visualization tools
Learn how to visualize given data in Excel. Learn about pie charts, histograms, scatter plots, and more.
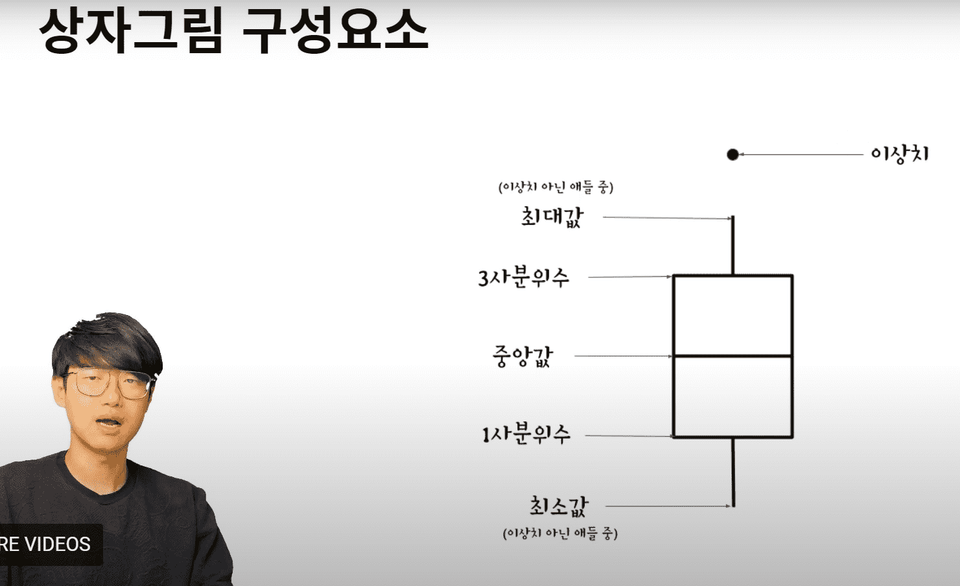
3) Statistical indicators that capture the center and spread of data
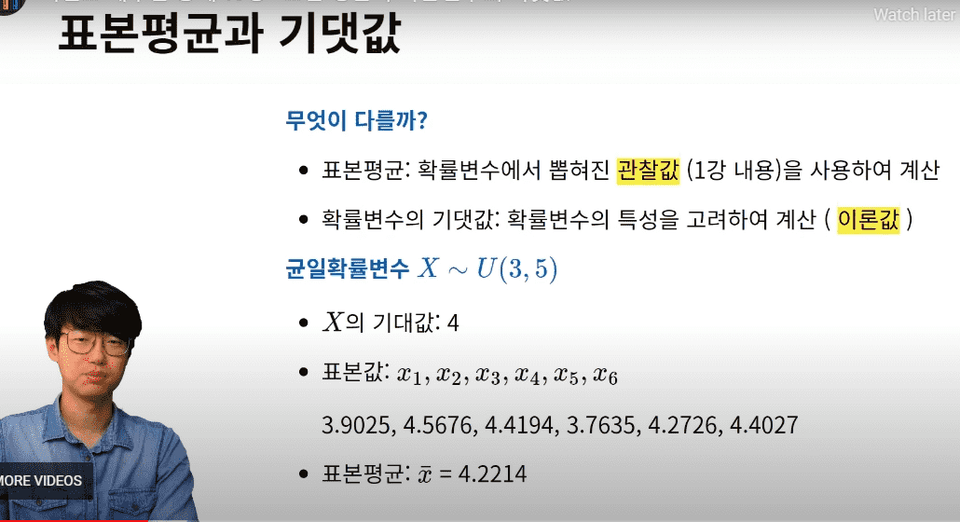
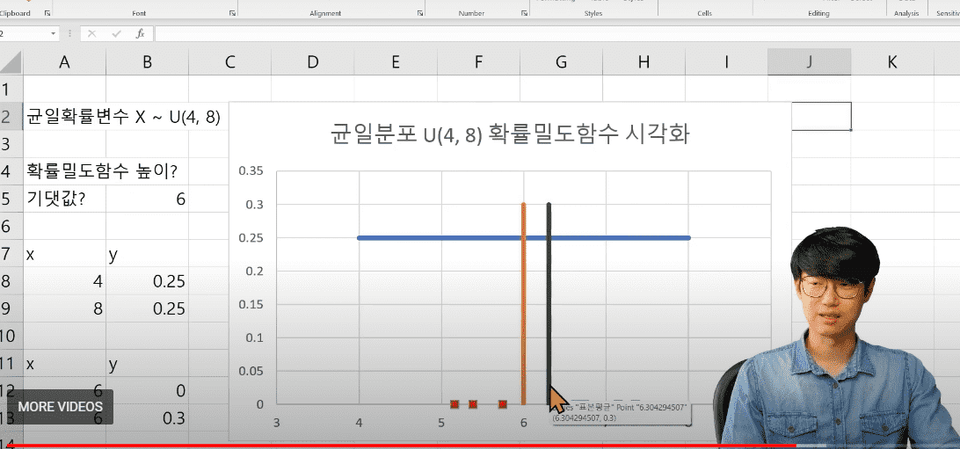
Learn statistical indicators that capture the characteristics of data distributions. You'll explore concepts such as mean, median, IQR, and variance. Understand the concepts of expected value and variance of random variables through visualization.
Learn about boxplots, which visualize the characteristics of a distribution using learned statistical indicators.
4) Digging into random variables
We will learn about the characteristics of random variables. We will deepen our understanding of random variables by understanding the concept of parameters and visualizing each concept. We will establish the concepts of random variables and samples and understand the laws of large numbers.
5) Building a foundation based on statistical inference
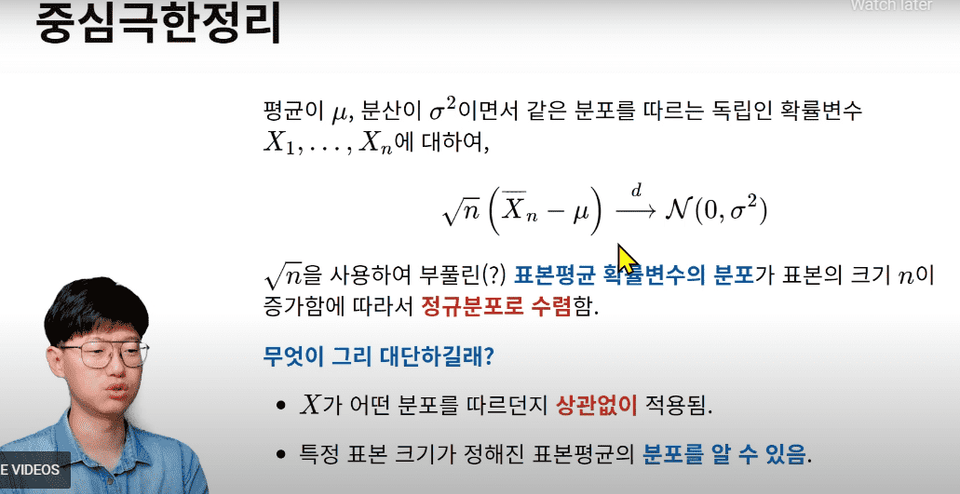
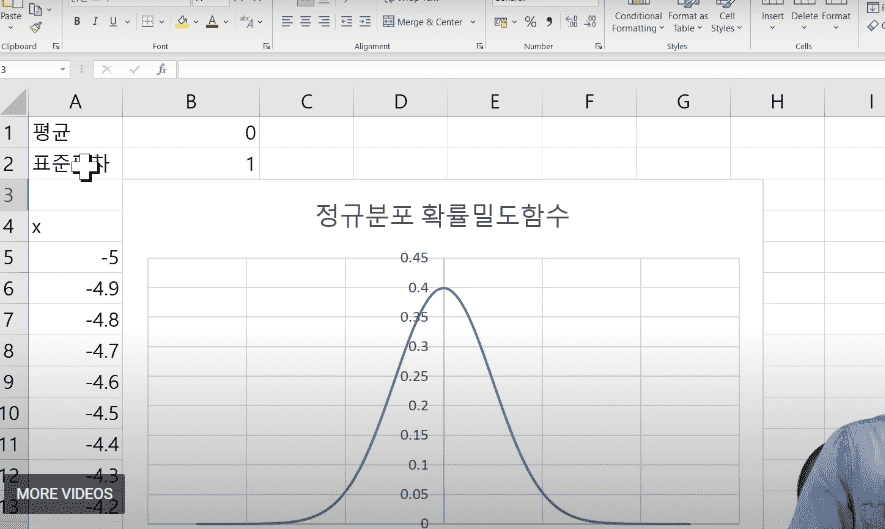
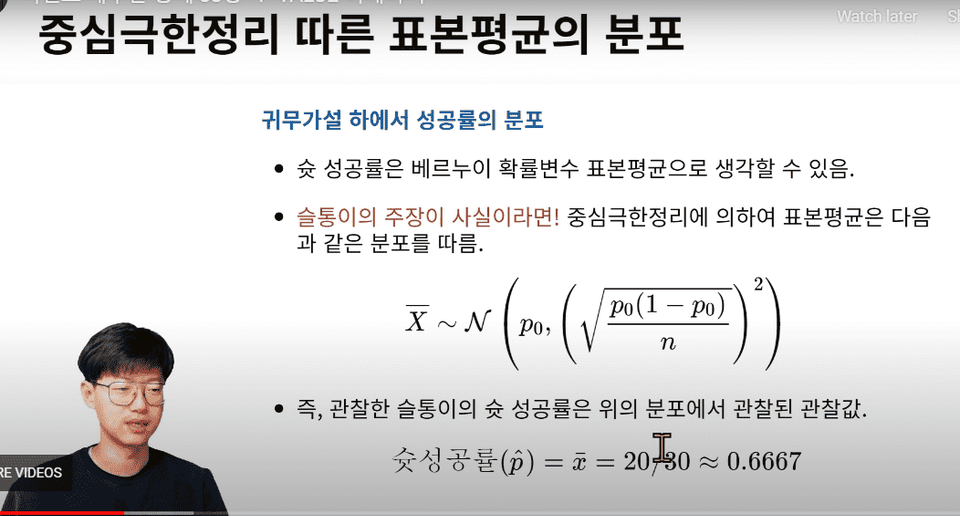
We will focus on understanding the central limit theorem, a fundamental principle of statistical inference. We will also study the properties of the normal distribution and learn how to calculate probability.
6) Understanding statistical inference
Gain a deeper understanding of confidence intervals and the statistical estimation process.
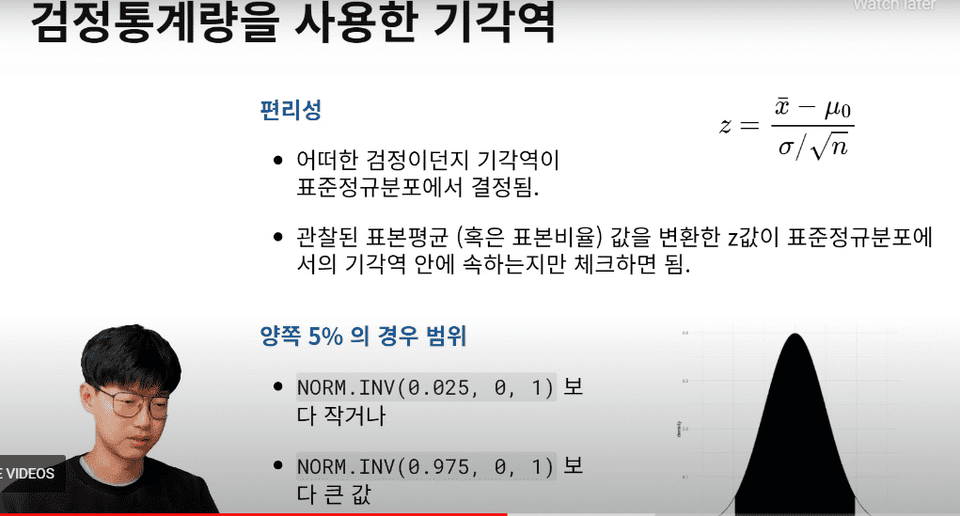
7) Understanding statistical tests
Learn statistical testing terminology and implement the entire process to understand the statistical testing process. Learn about statistical significance levels, rejection thresholds, p-values, and more.
Q. Is this a course that non-majors can also take?
You can think of this class as a foundational course that will enable non-statisticians to study like statistics majors.
Q. Do I need to be proficient in Excel before taking the course?
Since we teach using Excel, a basic understanding of the language is helpful, but this course is designed for those without it. We explain basic Excel functions and apply them to learn statistical knowledge, so prior knowledge of Excel is not required. :)
Q. What level of content is covered in the class?
This course will take you from a basic understanding of statistics to a level where you can understand statistical testing theory. After taking this course, you'll find it very helpful if you take a mathematical statistics course at school.
I'd like to share what I've learned and realized while studying statistics with those of you who are following my path. I hope this lecture will be a helpful resource, answering some of your questions. I also hope that for those who are following my path, I hope my footsteps will offer some comfort.
History
Academic background
It was very helpful. Thank you.
This is a very useful lecture for those who are familiar with Excel and want to learn the basic concepts of statistics.
Thank you for the quick lecture.
It was good

![Do you want to quit your job? If so, you should take the [Excel Function Dictionary] course.Course Thumbnail](https://cdn.inflearn.com/public/courses/328591/cover/e6c500ab-3346-48df-84a8-b7c0876eea16/함수사전(인프런).jpg?w=420)
![[R] Basics of Statistics for Machine LearningCourse Thumbnail](https://cdn.inflearn.com/public/courses/325155/course_cover/d8120723-26f7-4fcc-a25c-a99eef4ea0f6/machine-learning-statistics-r-eng.png?w=420)
![[Pass ITQ Excel A in One Go] in 3 daysCourse Thumbnail](https://cdn.inflearn.com/public/courses/329652/cover/b44e11b6-a47e-4993-86ea-a85da9836bb5/329652-eng.png?w=420)


![[Big Data Learning Center] *Free* 67th & 68th Open House - Bootstrapping and Structural Equation Modeling | Hierarchical Linear ModelingCourse Thumbnail](https://cdn.inflearn.com/public/files/courses/342202/cover/01krzgsx2bxpr2cy280qk257qp?w=420)