강의

멘토링

로드맵

Inflearn brand logo image
College Edu.

/

Mathematics

Statistical Analysis Master Class

Now is the time to answer based on data rather than experience! If you quantify the reliability with statistical knowledge and present it as evidence, your persuasiveness will increase infinitely!

(4.5) 19 reviews

150 learners

  • Masocampus
통계
데이터분석
수학
Statistics

Reviews from Early Learners

What you will learn!

  • Descriptive statistics and visualization skills to read and summarize collected data

  • The ability to predict future data using probability and inference.

  • Various statistical analysis capabilities such as chi-square test, T-test, and regression analysis

  • The ability to find the optimal way to solve real-world business problems (Business Questions)

Learn statistics that can be applied directly to reality.
Discover statistical principles in life! 📈

🔹Please check before taking the class!

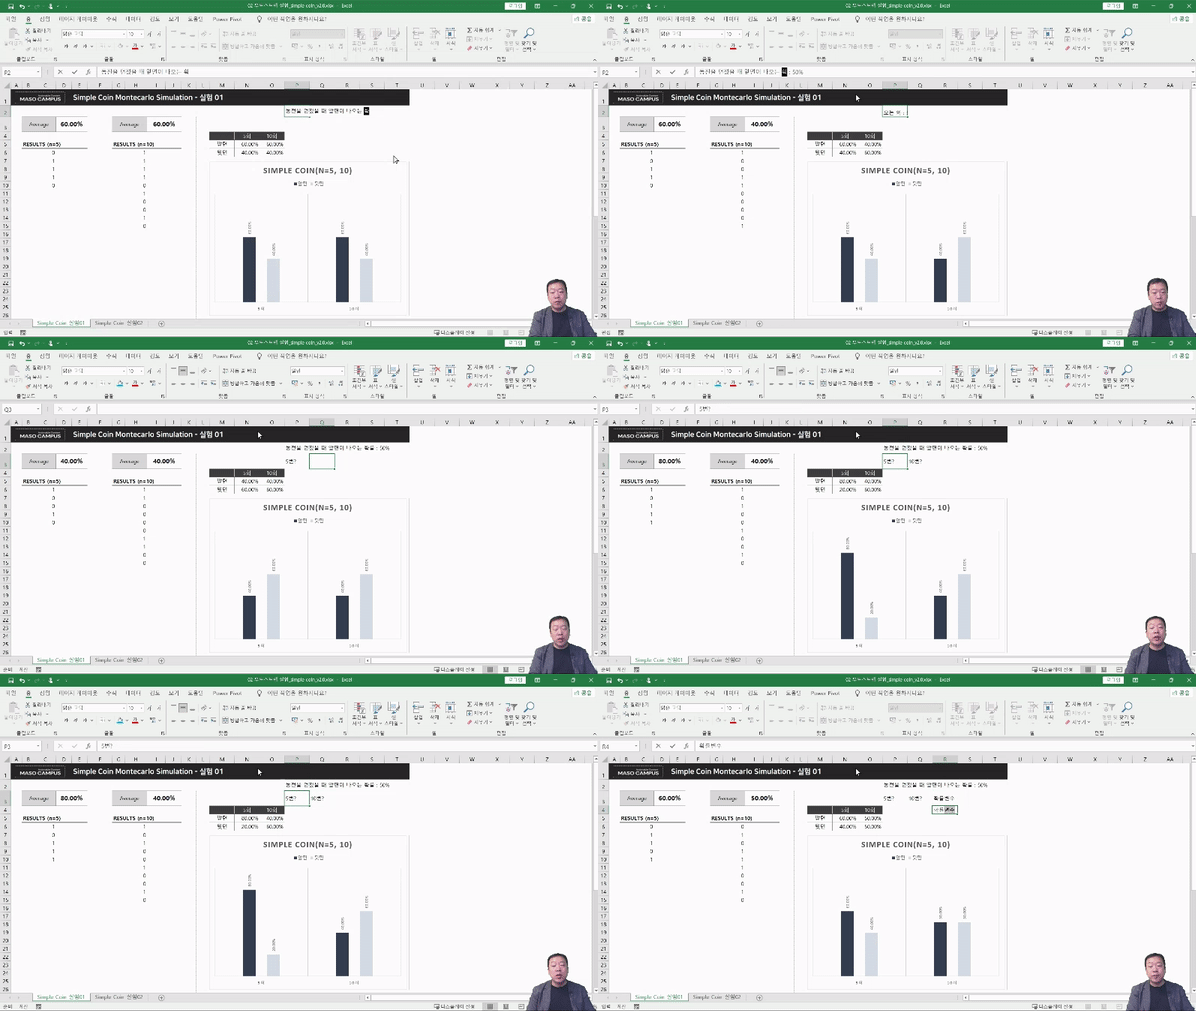
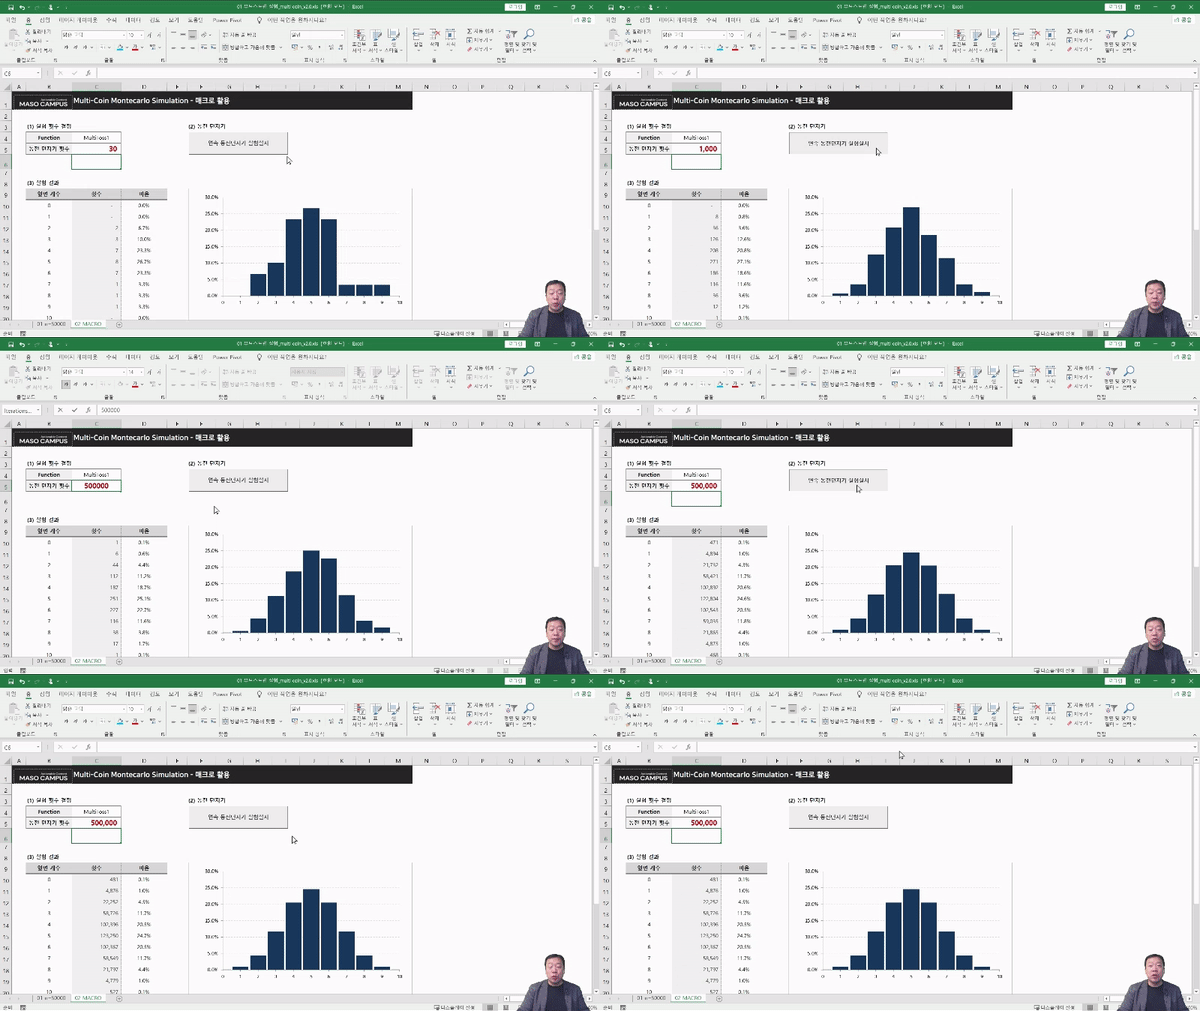
    • Since this is a practice-oriented lecture, it would be a good idea to prepare a dual monitor or extra device that can separate the lecture and practice screens.
    • Since the training will be conducted on Windows OS , we recommend taking the course in a Windows environment.
    • Lecture notes and practice files are available in the <99 Textbook Download Center> section at the bottom.


The basics of data analysis
It starts with statistical knowledge.

  • Useful in real life.
    Did you know that our daily lives are steeped in statistics? Statistics can help us find answers to the issues that arise in our daily lives!

  • Rational thinking is possible.
    You will learn to focus on the meaning behind numbers, rather than just looking at them as numbers.

  • You can distinguish between real and fake.
    Why do articles on the same issue have different stances? Now you can directly interpret the statistics to identify the true article.

  • Data-driven decisions are possible.
    Company B's monthly sales are said to be 30 million won. Is 30 million won really a good result? You can use statistics to answer this question.
    To what extent can raising cigarette prices reduce smoking among young people?
    How much does job training increase re-employment rates?
    Data can be used to determine whether increased foreign direct investment leads to higher economic growth rates.


I recommend this to these people ✨

I'm scared of math, so I'm into statistics
Anyone who felt a barrier

Data analysis project
Those who want to develop planning skills

Apply statistical analysis directly to practice
For those who want to apply and find insights

Business analytics capabilities
People who want to cultivate


Unique features of this course 🔷

#1.
Build a solid foundation!

This course is designed to provide step-by-step learning of statistical knowledge that can be applied continuously in practice. The moment you master the statistical knowledge necessary for practical work, you'll master the use of analytical tools and generate business insights that drive results. Learn practical statistics once and apply them consistently!

#2.
Combined with practical
statistical analysis lecture

We begin by organizing the most fundamental statistical concepts, from data types to variance and standard deviation. This course is more than just a guide, but rather a guide that helps you understand the concepts through examples that incorporate business cases. By solving practical examples, you'll gain a solid understanding of both statistics and practical applications without getting bored.

#3.
Winning Business Strategy

By focusing on practical BQs rather than theoretical statistical analysis, you can immediately develop project understanding and planning skills. This time-saving, actionable curriculum reduces the inefficiency of memorizing theory and applying it to practice, focusing on examples and hands-on practice.

💡 After taking the Statistical Analysis Master Class, you will be able to acquire these skills.

  • Descriptive statistics and visualization skills to read and summarize collected data
  • The ability to predict future data through probability and inference
  • Various statistical analysis capabilities such as chi-square test, t-test, and regression analysis
  • The ability to find the optimal way to solve real-world business problems (Business Questions)

What you'll learn 📚

Data bootstrapping
Let's check the uncertainty of the estimates by quantifying it.

Central limit theorem
Provides a probabilistic basis for estimating population parameters.

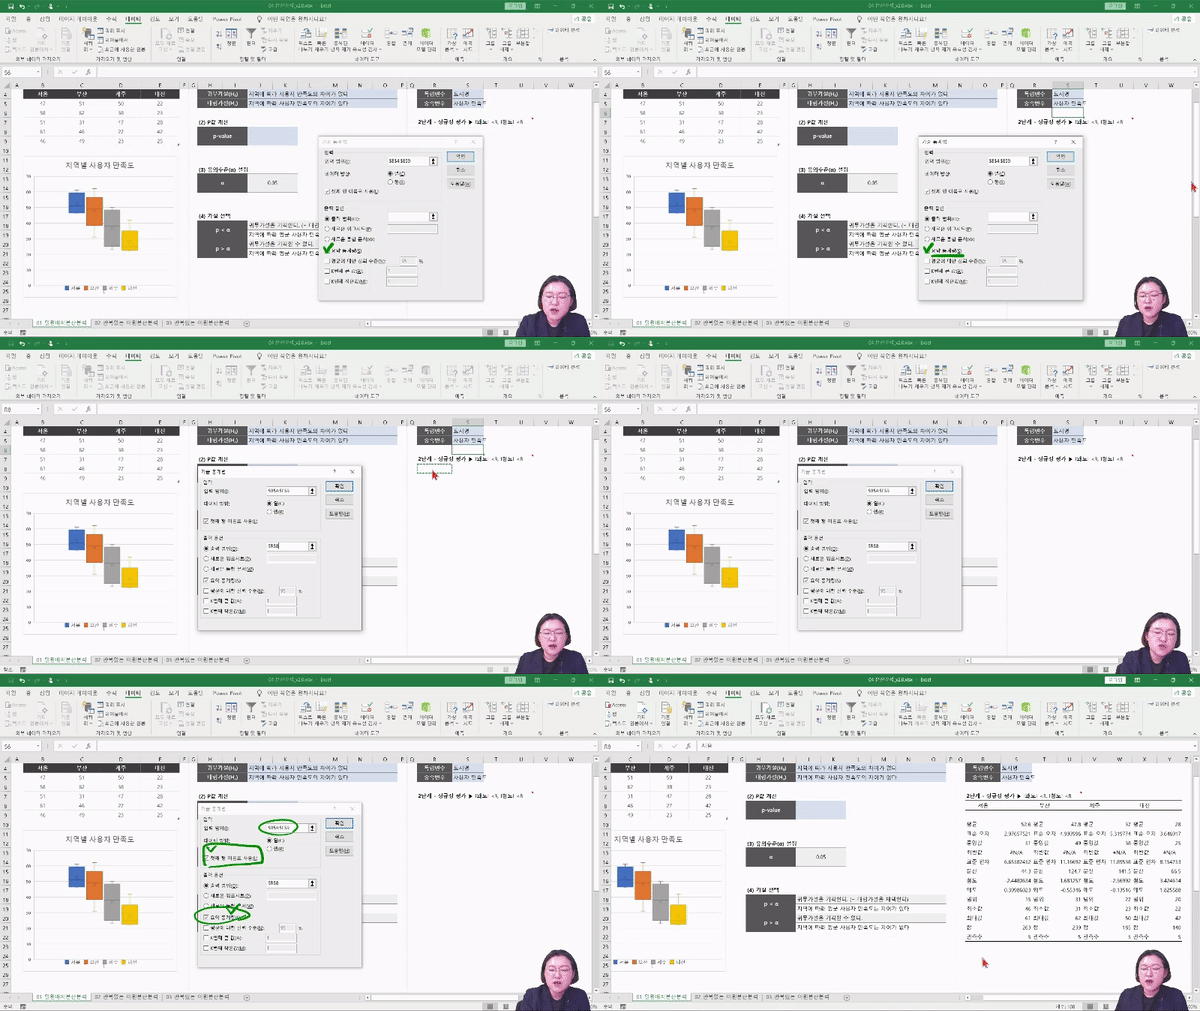
One-way ANOVA
Between one dependent variable and one independent variable
Want to figure out the relationship?

Practical Project
Now it's time for the real thing, the factors that affect sales.
Let's discover and grow your sales!

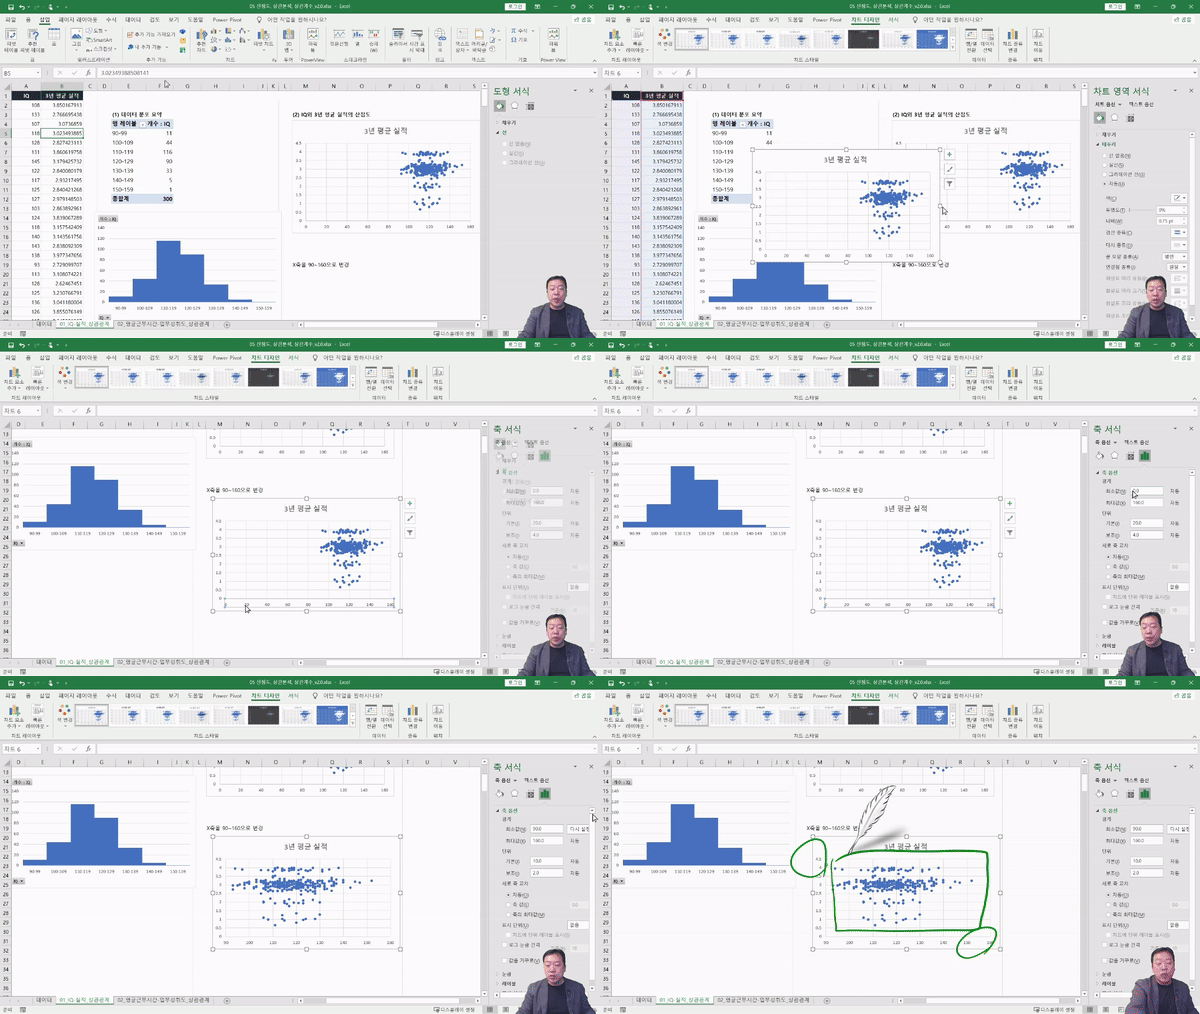
Drawing a scatter plot
See the relationships between multiple variables at a glance!

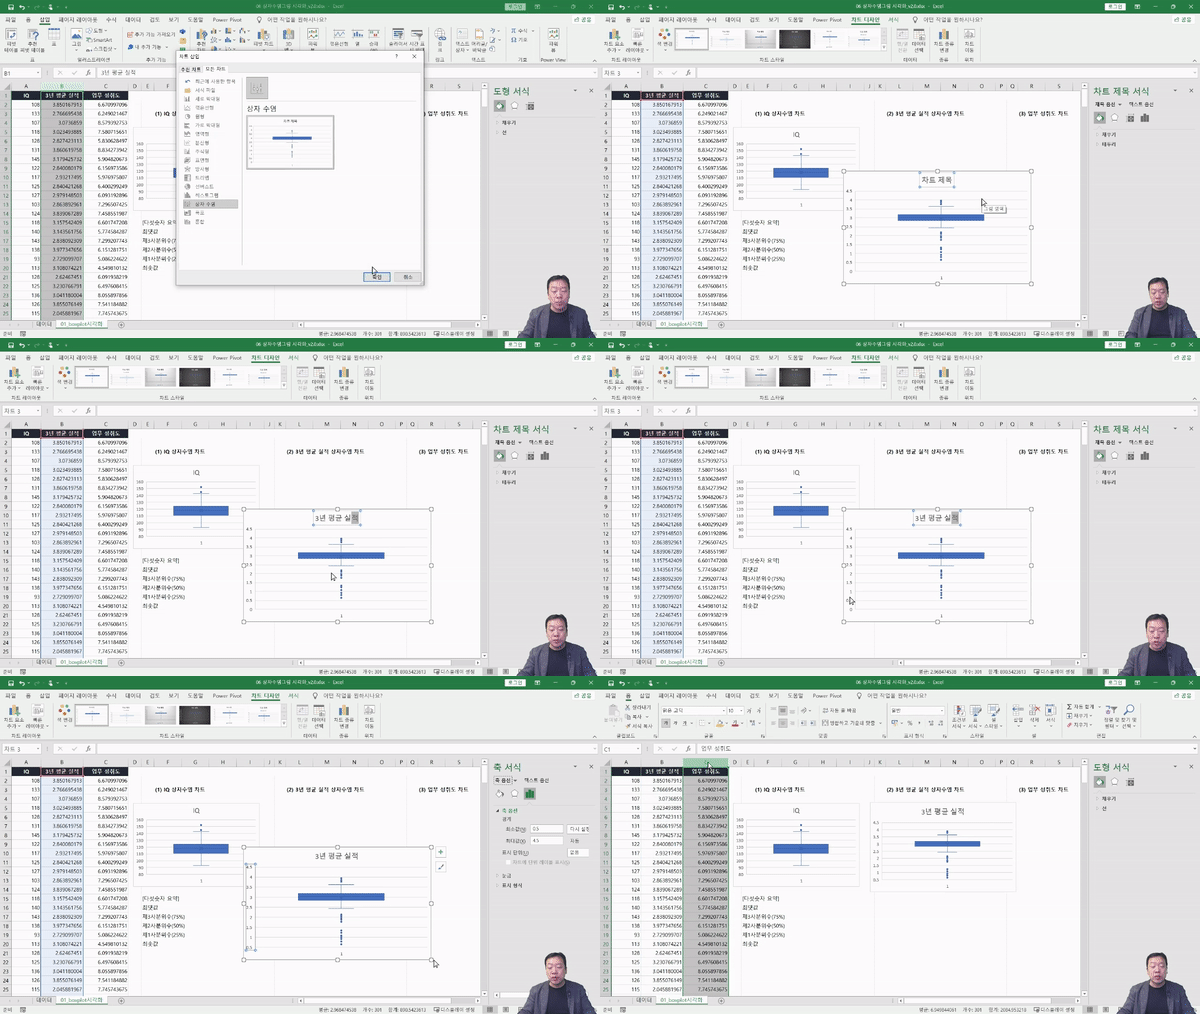
Box and whisker plot visualization
When you want to see only the important values obtained from the data at a glance!

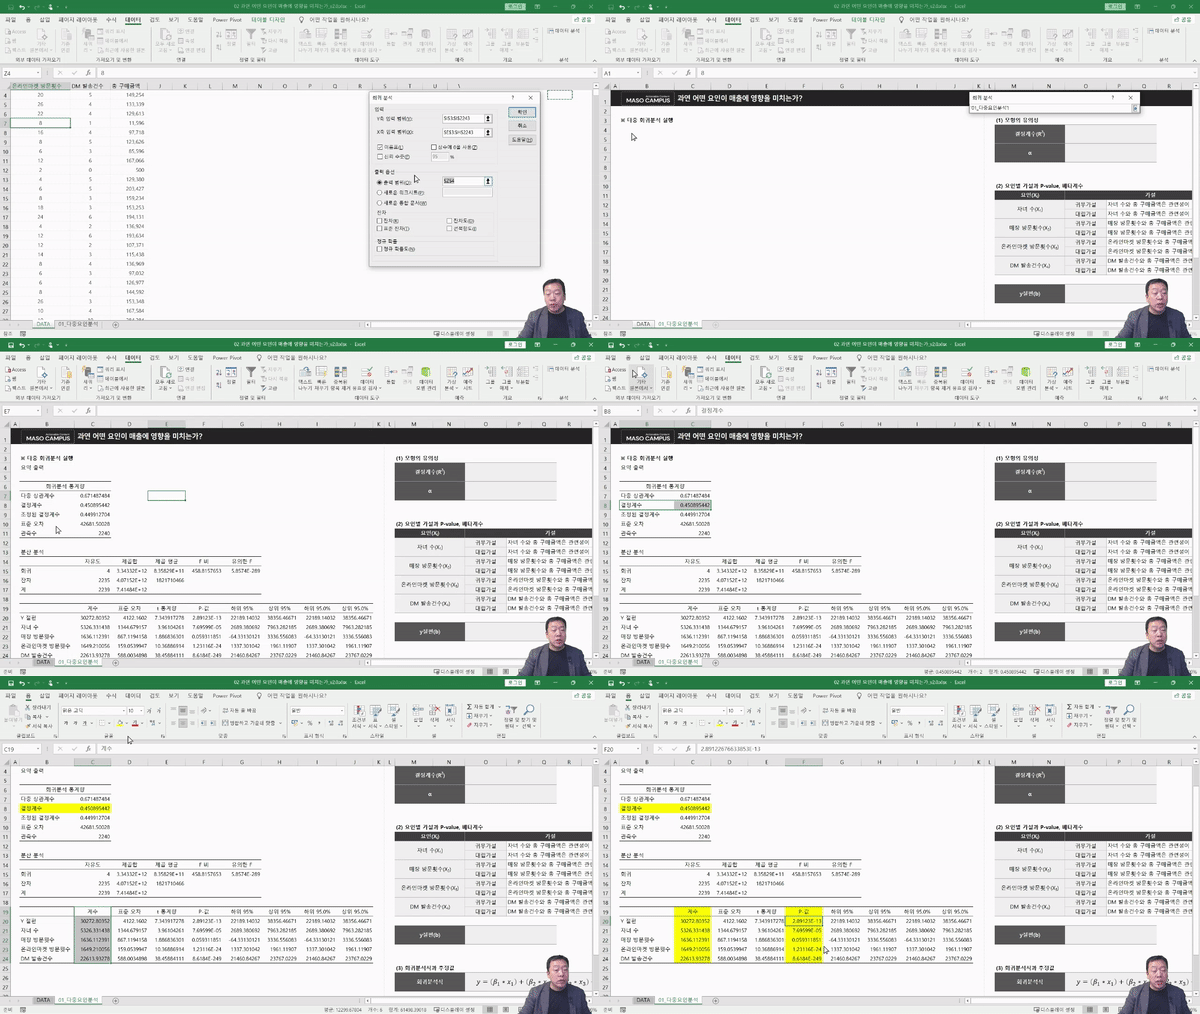
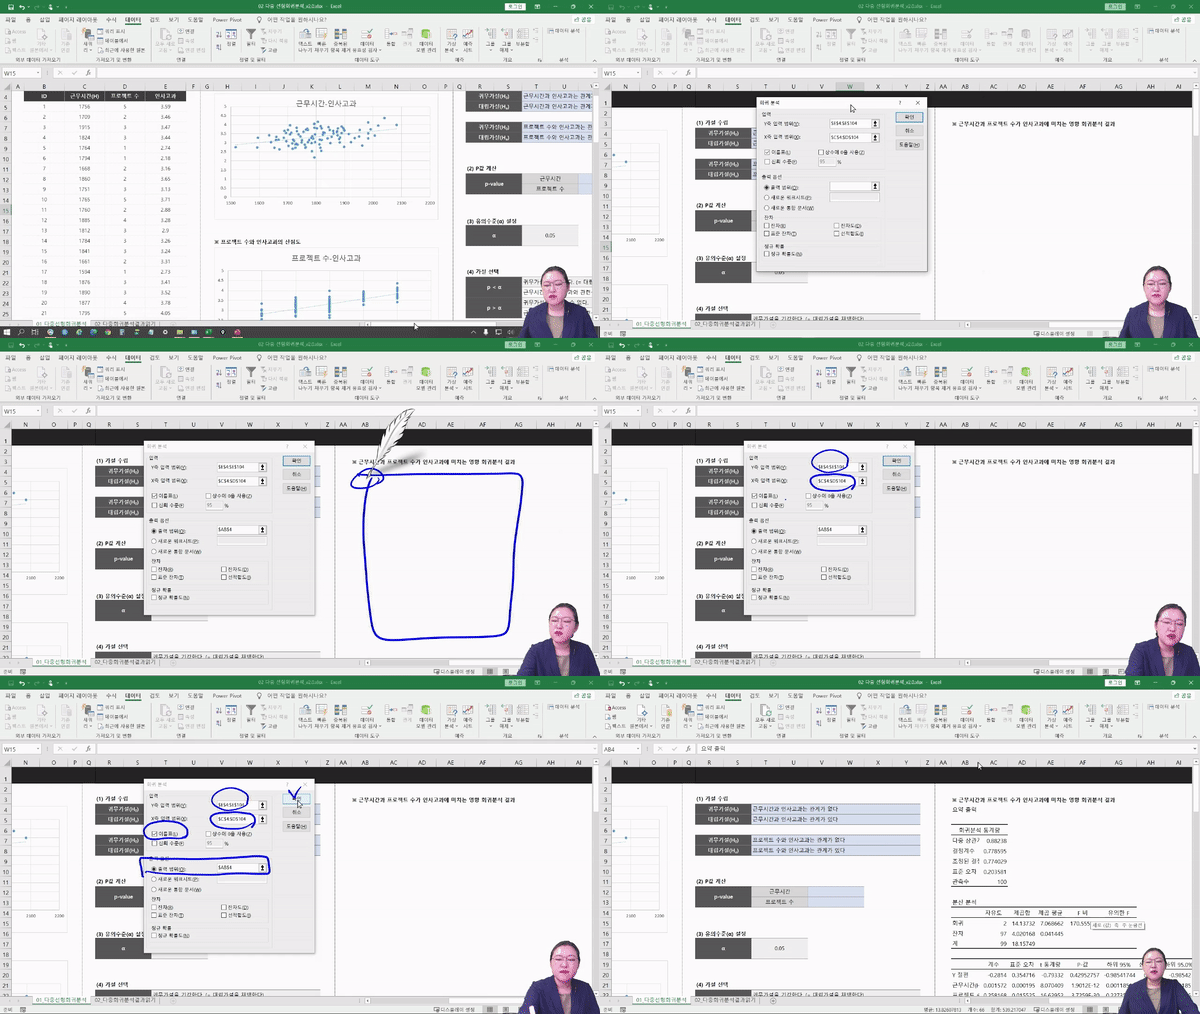
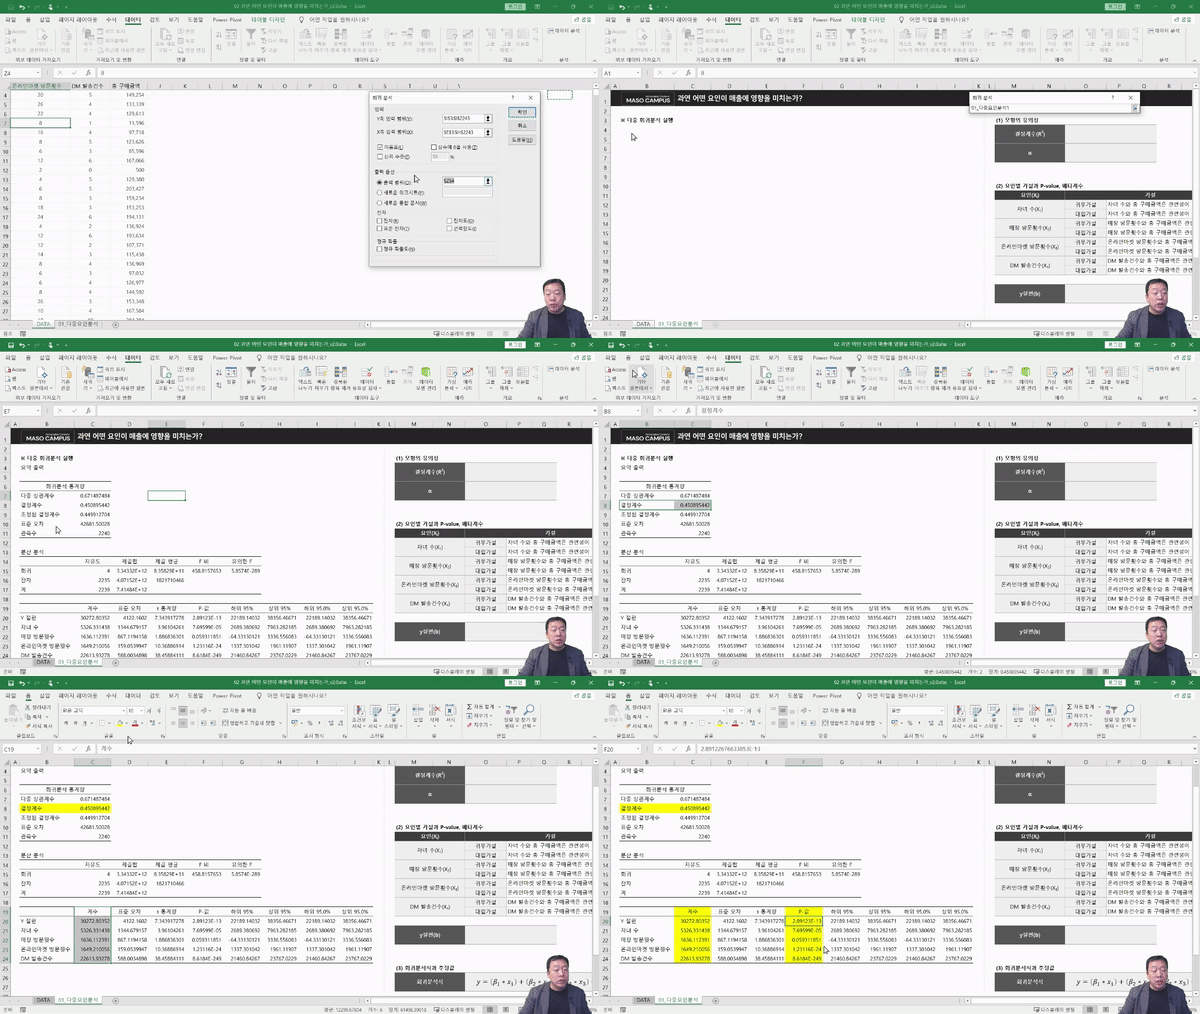
Linear regression analysis
The hypothesis I made... is it true?
Now we can talk about 'real' data.

Practical Project
Let's learn statistics that can be used in real life!
Get familiar with statistics through various practical projects.


Expected Questions Q&A 💬

Q. Can I follow the lecture without basic statistical knowledge?

This course begins with an introduction to the most fundamental terms and concepts, from data types to variance and standard deviation. It uses everyday examples to help you understand each concept, and it even goes so far as to explain effective visualization methods tailored to your analysis goals and data. Whether you're struggling with statistics or a beginner, this course is suitable for everyone!

Q. Do I need to be proficient in Excel to follow the class?

You don't have to worry about your Excel skills being lacking, as we go through each and every button you need to click.

Q. Basically, do I need to be good at high school math to be able to take the course?

This course breaks the stereotype of traditional statistics lectures that require students to sit through boring mathematical concepts. It's a course filled with Masocampus' unique expertise, developed with a focus on essential application skills. You can take it without any worries.


Introducing the Knowledge Sharer ✒️

Recommended for
these people

Who is this course right for?

  • People who were afraid of math and felt a barrier to statistics

  • Those who want to develop data analysis project planning skills

  • Non-majors who want to understand statistics properly through practice

  • For those who want to find insights by directly applying statistical analysis to their work

  • Anyone who wants to develop business analytics capabilities and combine data science with business decision making

  • People who dream of “starting a business/joining a company/changing jobs/re-skilling/talent transformation”

Hello
This is

7,026

Learners

857

Reviews

96

Answers

4.7

Rating

85

Courses

"어제보다 성장하겠습니다. 그리고, 어제보다 성장하려는 사람을 돕겠습니다."


마소캠퍼스의 진심과 소망을 담은 Actionable Content로,

2013년부터 온오프라인으로 함께해 온 누적 강의 1억시간!

이 소중한 경험과 시간은 언제나 마소캠퍼스와 수강생 모두의 성장의 원천입니다.


마소캠퍼스 팀은 우리의 모두의 성장을 위해 두 가지 원칙을 반드시 지킵니다.


1. 배우면 반드시 쓸 수 있는 Actionable Content

2. 참여자의 시간과 수고를 존중하는 Time-Saving Curriculum


마소캠퍼스의 Actionable and Time-Saving Curriculum으로 성장의 길을 함께 걸어나가길 기원합니다.

Curriculum

All

88 lectures ∙ (20hr 3min)

Course Materials:

Lecture resources
Published: 
Last updated: 

Reviews

All

19 reviews

4.5

19 reviews

  • MUKAI IKUHO님의 프로필 이미지
    MUKAI IKUHO

    Reviews 1

    Average Rating 5.0

    5

    19% enrolled

    경영학을 전공하고 있어서 학교 수업을 따라가기 위해 수강하기 시작했습니다!! 어려운 용어도 일본어 자막이 있어서 바로 머리에 들어옵니다!!!! 이제 졸업 논문도 두렵지 않아!!!

    • Masocampus
      Instructor

      レビューを残していただき、ありがとうございます!! これからも成長し続けるMASOCAMPUSの講義をどうぞよろしくお願いいたします!!

  • 아야님의 프로필 이미지
    아야

    Reviews 1

    Average Rating 5.0

    5

    11% enrolled

    대학원 수업보다 훨씬 이해하기 쉬웠습니다!! 다니고 있는 대학원에서 수업을 해주셨으면 할 정도입니다!! 이제 논문을 쓰는 데 있어서 정말 많은 도움이 되었습니다! 많은 사람들이 이 영상을 보면 좋겠습니다!

    • Masocampus
      Instructor

      高評価をいただき、本当にありがとうございます!! いつか아야さんの大学院で授業ができる日を夢見て、一生懸命講義を続けてまいります!!

  • 굴삭기님의 프로필 이미지
    굴삭기

    Reviews 4

    Average Rating 5.0

    5

    100% enrolled

    (좋은 의미로써)지겨울 정도로 통계 방법론을 예제를 통해 아주 쉽게, 반복적으로 가르쳐주시고 실습 파일 구성도 매우 알찹니다. 저는 통계학을 이론적으로만 배웠고, 분석 실무만 하다보니 공부한 뒤로 시간이 많이 지나 잊어버렸어요. 예를 들면 개념을 보면 대충은 알겠는데 정확한 의미와 해석, 그리고 적용이 잘 안되는 상태와 비슷했습니다. 그런데 이 강의는 한 눈에 숲을 보는 것처럼 단계별 구성이 잘 되어 있습니다. 실습자료 또한 매우 구체적이고 현실적이라 실무에서 적어도 여러 번 겪어본 경우였습니다. Python과 같은 단순히 분석을 위한 도구를 잘 다루는 관점의 강의가 아니고, 이론을 직관적으로 잘 이해하면서도 실무에 어떻게 잘 녹여낼 것인지 강조된 강의이므로 얕은 개발 지식조차 없어도 통계에 기반한 정석적인 데이터 분석에 대해 잘 배울 수 있습니다. 다만, 회사나 조직별로 기대하는 바나 데이터 수준이 달라서 여기서 배우는 많은 내용을 실무에서 활용할 기회가 주어지지 않을 수도 있습니다. (많은 회사가 단순한 기술통계나 데이터 추출 결과만 가지고 의사결정하는 경우가 종종 있는 것처럼) 이 강의는 그럴 때마다 다시 들여다보며 복습하고 기본기를 다시 확인하기 좋은 것 같습니다. 분석가나 기획자라면 반드시 들어보면 좋을 강의 같습니다. 나중에 또 듣게 강의가 내려가지만 않으면 좋겠네요. 잘 들었습니다. 감사합니다.

    • Masocampus
      Instructor

      저희 강의가 도움이 되었다니 너무 기쁘네요! 말씀 남겨주신 것처럼 언제든 다시 보실 때 도움되는 것을 목표로 제작하였습니다😊 정성스런 수강평 남겨주셔서 감사합니다!

  • batman0228님의 프로필 이미지
    batman0228

    Reviews 1

    Average Rating 5.0

    5

    31% enrolled

    • nrkim님의 프로필 이미지
      nrkim

      Reviews 4

      Average Rating 5.0

      5

      100% enrolled

      $77.00

      Masocampus's other courses

      Check out other courses by the instructor!

      Similar courses

      Explore other courses in the same field!