Document Automation with R and Python (Basics)
statisticsplaybook
You can build the basic stamina to leave work on time by automating report writing.
Basic
RMarkdown, LaTeX, R
Statistics learned in school, was it too hard to understand? No matter how much you listened to the explanation, statistics were confusing, but we will help you understand them. If you implement them one by one by hand using Excel, you will understand statistical concepts that you didn't understand! A new experience that makes boring statistics fun! We will give you a gift. :)
Reviews from Early Learners
5.0
bu.yu
Thank you for the quick lecture.
5.0
상명
It was good
5.0
조연수
It was very helpful. Thank you.
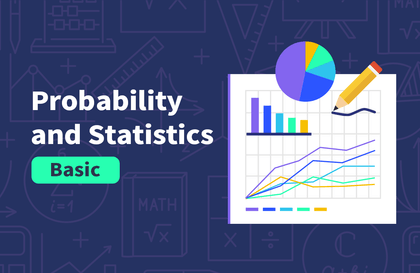
A general understanding of basic statistics!
Statistical knowledge that you can learn by seeing it with your own eyes if you follow it step by step.
The logic behind basic statistical theory and statistical testing,
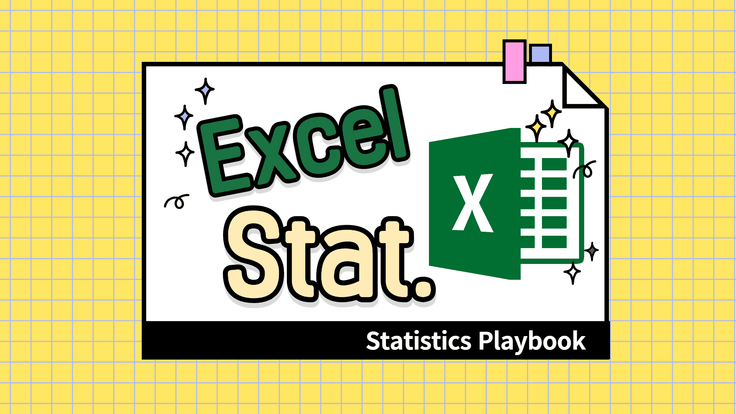
Understand while implementing it in Excel 🔦
Statistics classes in school are so hard to understand, aren't they? Especially the ones about tests, no matter how many times you hear about them, they're still confusing! The truth is, statistics is difficult because we lack a basic understanding of the underlying theories behind them. Once you understand the background of statistical tests and study them, nothing is more fun than statistics! :)
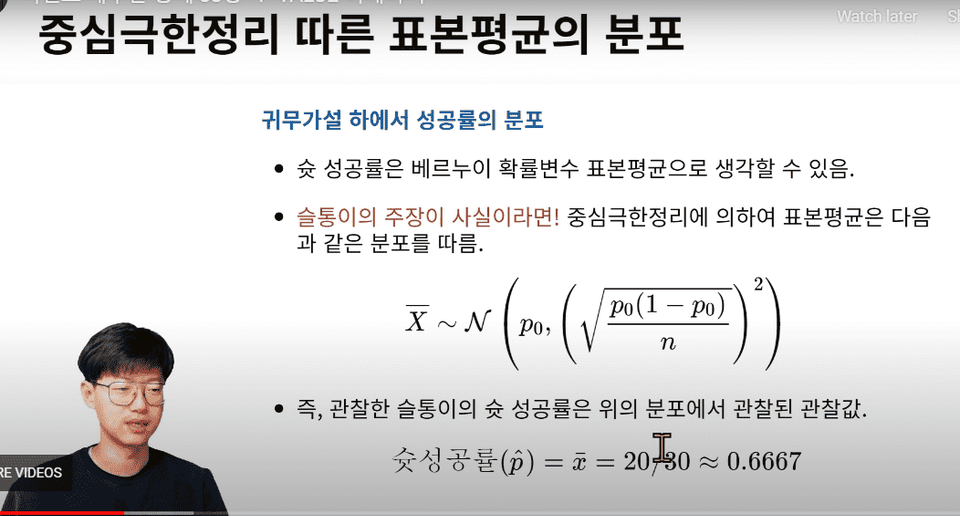
In this course, you'll learn the properties of basic statistical indicators , the laws of large numbers and the central limit theorem, fundamental statistical concepts , and establish a solid understanding of confidence intervals, statistical significance levels, and p-values . This course is filled with my teaching expertise, accumulated while teaching basic statistics to undergraduates at American universities. Statistics can be difficult, but we make it fun.
Unique features of this course 🪄

Someone who feels better when they implement something themselves

People who learn by giving specific examples when studying

Those who don't understand basic statistics and just memorize and solve problems

For those who want to know why they learn statistical theory
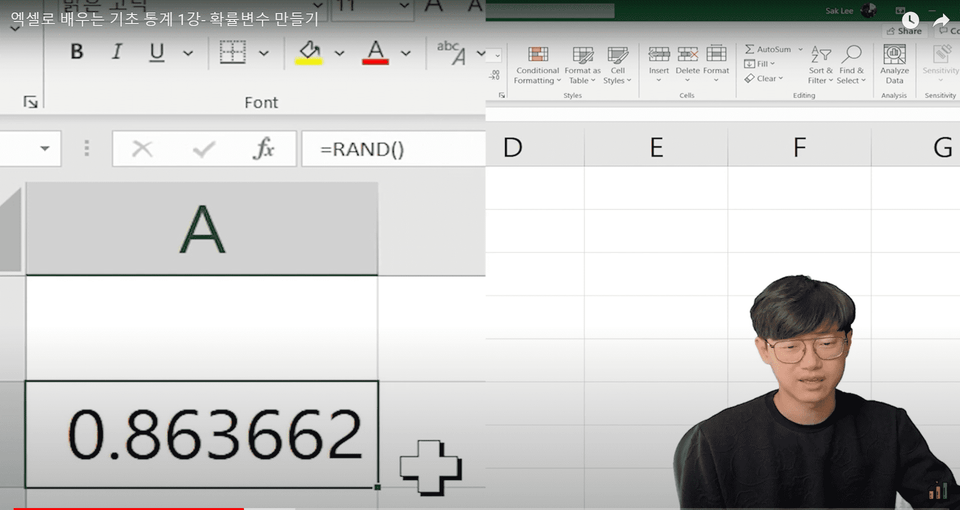
1) Random variables and samples
We'll create random variables ourselves and learn about their properties. This will establish concepts about random variables and sampling. We'll use the RAND() function to create virtual coins and learn about Bernoulli random variables.
2) Data visualization tools
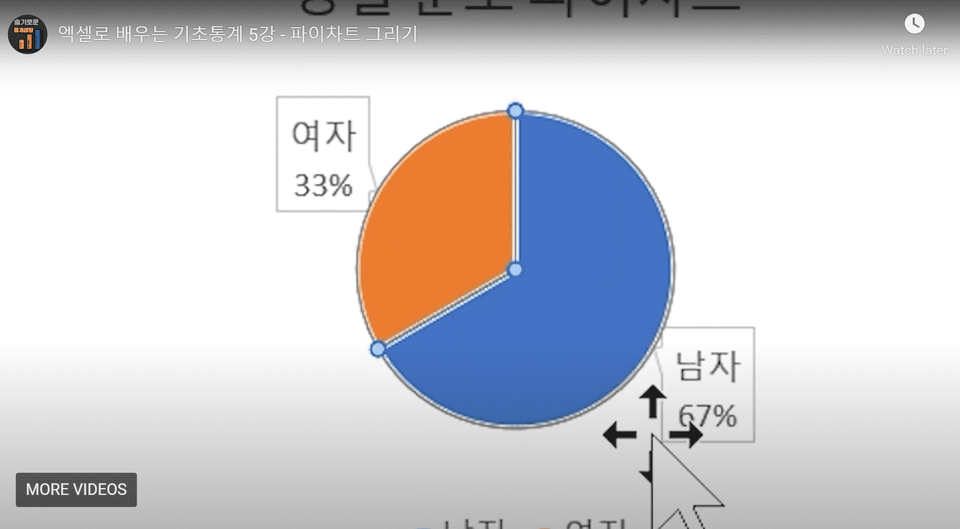
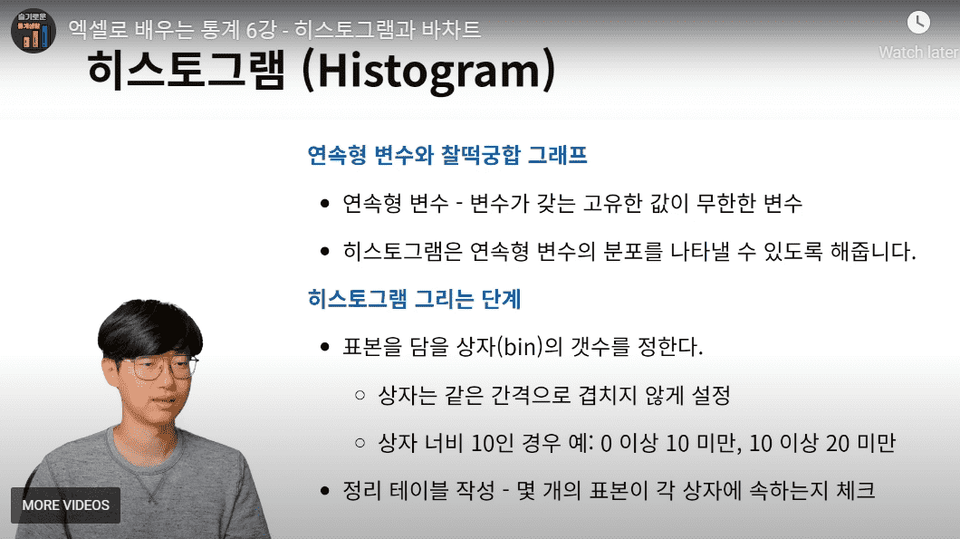
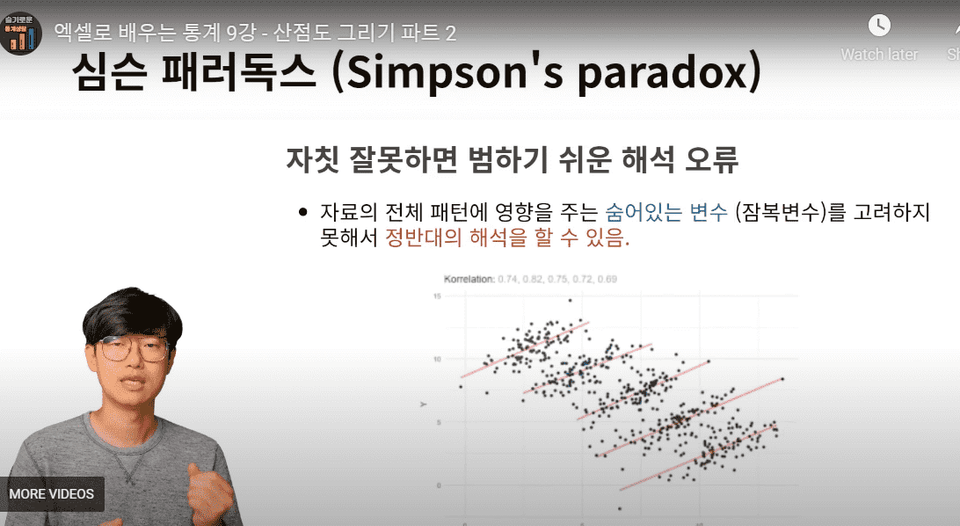
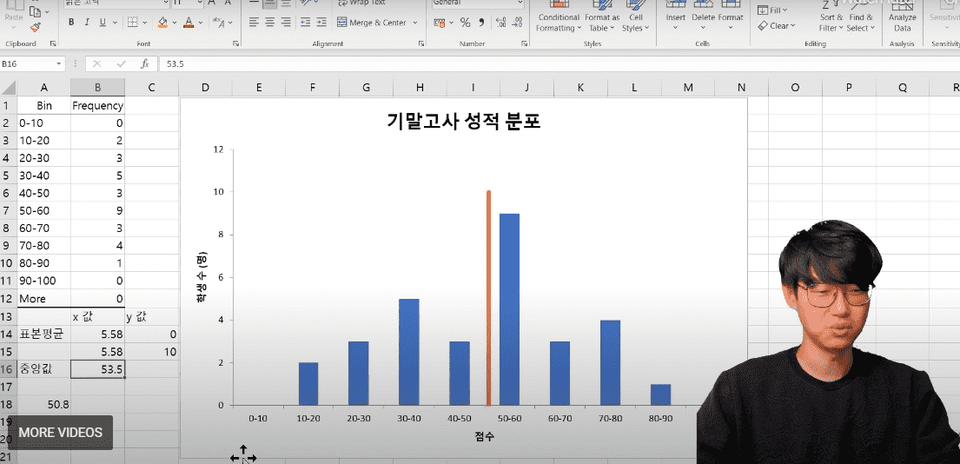
Learn how to visualize given data in Excel. Learn about pie charts, histograms, scatter plots, and more.
3) Statistical indicators that capture the center and spread of data
Learn statistical indicators that capture the characteristics of data distributions. You'll explore concepts such as mean, median, IQR, and variance. Understand the concepts of expected value and variance of random variables through visualization.
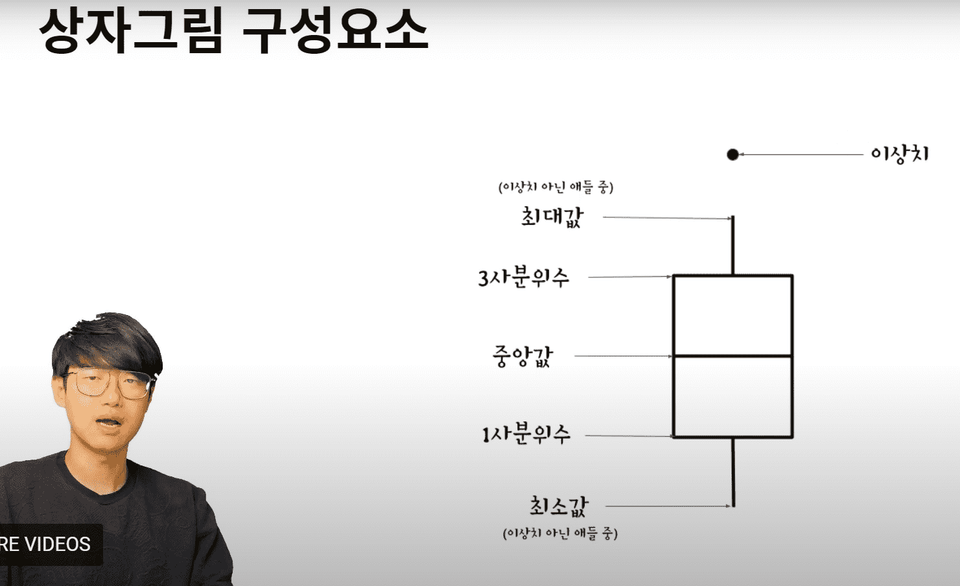
Learn about boxplots, which visualize the characteristics of a distribution using learned statistical indicators.
4) Digging into random variables
We will learn about the characteristics of random variables. We will deepen our understanding of random variables by understanding the concept of parameters and visualizing each concept. We will establish the concepts of random variables and samples and understand the laws of large numbers.
5) Building a foundation based on statistical inference
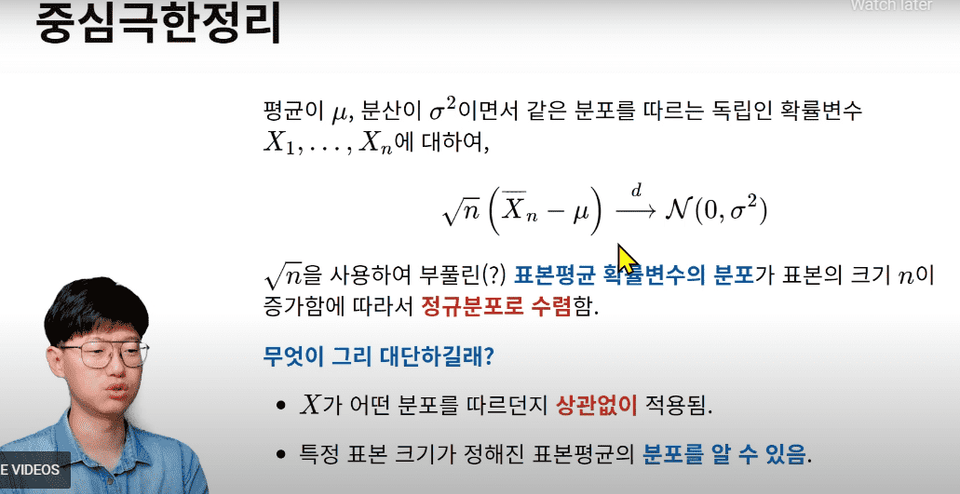
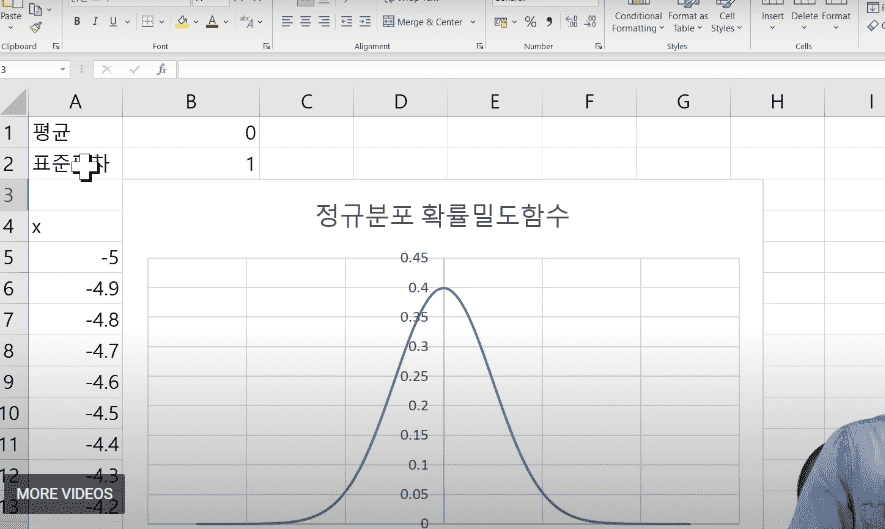
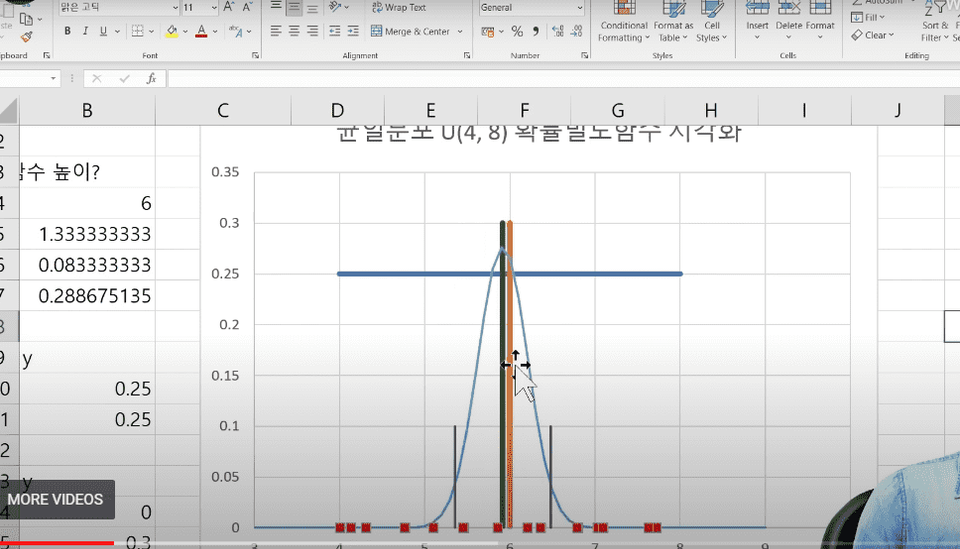
We will focus on understanding the central limit theorem, a fundamental principle of statistical inference. We will also study the properties of the normal distribution and learn how to calculate probability.
6) Understanding statistical inference
Gain a deeper understanding of confidence intervals and the statistical estimation process.
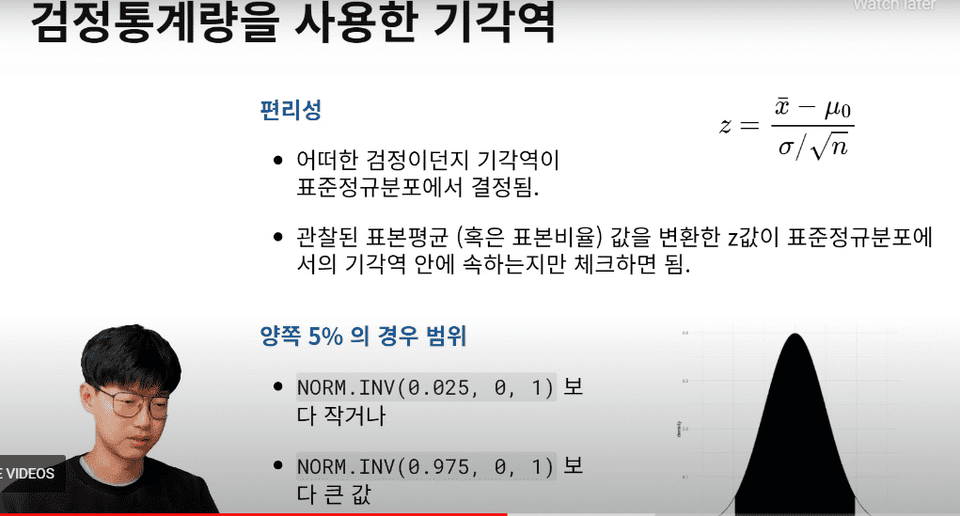
7) Understanding statistical tests
Learn statistical testing terminology and implement the entire process to understand the statistical testing process. Learn about statistical significance levels, rejection thresholds, p-values, and more.
Q. Is this a course that non-majors can also take?
You can think of this class as a foundational course that will enable non-statisticians to study like statistics majors.
Q. Do I need to be proficient in Excel before taking the course?
Since we teach using Excel, a basic understanding of the language is helpful, but this course is designed for those without it. We explain basic Excel functions and apply them to learn statistical knowledge, so prior knowledge of Excel is not required. :)
Q. What level of content is covered in the class?
This course will take you from a basic understanding of statistics to a level where you can understand statistical testing theory. After taking this course, you'll find it very helpful if you take a mathematical statistics course at school.
I'd like to share what I've learned and realized while studying statistics with those of you who are following my path. I hope this lecture will be a helpful resource, answering some of your questions. I also hope that for those who are following my path, I hope my footsteps will offer some comfort.
History
Academic background
Who is this course right for?
For those who are studying basic statistics for the first time
For those who want to study statistics visually through Excel
Need to know before starting?
Excel Basics (Recommended)
7,320
Learners
187
Reviews
42
Answers
4.8
Rating
5
Courses
Tôi muốn chia sẻ những gì mình đã học và nhận ra trong quá trình nghiên cứu thống kê với các bạn, những người đang đi trên con đường mà tôi đã từng đi qua. Hy vọng rằng đây sẽ là những bài giảng hữu ích giúp giải đáp thắc mắc cho một số người. Đồng thời, tôi cũng mong rằng dấu chân của mình, một người đi trước, sẽ phần nào trở thành niềm an ủi cho những ai đang bước đi trên con đường mà tôi đã từng đi.
Thân ái, Isaac.
Thống kê cuộc sống thông thái Đại diện
Nghiên cứu sinh Tiến sĩ (ABD), chuyên ngành Thống kê & Khoa học Định phí bảo hiểm, Đại học Iowa
Thạc sĩ Khoa học tính toán bảo hiểm, Đại học Sungkyunkwan
Bachelor's degree in Statistics and Industrial Engineering, Sungkyunkwan University
YouTube Channel: Wise Statistics Life
All
41 lectures ∙ (6hr 20min)
Course Materials:
All
10 reviews
4.1
10 reviews
Reviews 1
∙
Average Rating 5.0
Reviews 2
∙
Average Rating 5.0
Reviews 1
∙
Average Rating 5.0
Reviews 5
∙
Average Rating 5.0
Reviews 1
∙
Average Rating 5.0
Check out other courses by the instructor!
Explore other courses in the same field!
$114.40

![[R] Basics of Statistics for Machine LearningCourse Thumbnail](https://cdn.inflearn.com/public/courses/325155/course_cover/d8120723-26f7-4fcc-a25c-a99eef4ea0f6/machine-learning-statistics-r-eng.png?w=420)


![[Pass ITQ Excel A in One Go] in 3 daysCourse Thumbnail](https://cdn.inflearn.com/public/courses/329652/cover/b44e11b6-a47e-4993-86ea-a85da9836bb5/329652-eng.png?w=420)