Learning Statistics with R
statisticsplaybook
For those of you who are having a hard time with college statistics, a senior who was in the same position will share his know-how. Conquering basic statistics using R programming
入門
Statistics, R
Are you still drawing graphs in Excel? Let's improve the quality of graphs, which are the core of report writing. Are you looking up the ggplot function you use every day every time? Let's take this opportunity to organize it all.

Reviews from Early Learners
5.0
쿠카이든
Learned a lot about R! Thank you for the great lecture!
5.0
cosmo7
good lecture ~~
5.0
허종덕
Thank you for your effort
Summary of frequently used functions in the ggplot2 package
How to draw a graph for a research paper
Data Visualization
Draw statistical graphs quickly with the ggplot2 package!

This course is designed to give those who have a basic understanding of R programming a taste of intermediate graphic techniques, while also quickly summarizing what those who have been using the ggplot2 package know.
For those who have taken my previous Inflearn lecture (Basic Statistics with R), this would be a good class to move on from the basic graphics used in the previous class to graphics that can be used in papers or reports using the ggplot2 package.
This lecture can be considered a summary or a taster course on statistical graphs. It is designed to help you naturally understand the concepts and methods of drawing graphs pursued by the ggplot package by following examples.
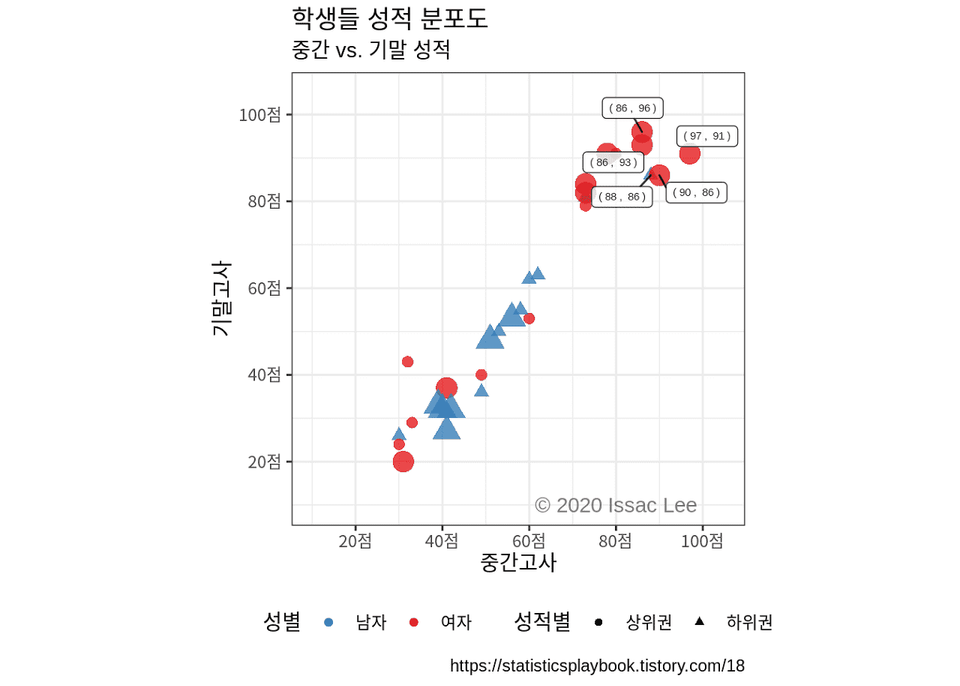
After completing the lecture, you will understand how to draw the following scatter plot.

As someone who has studied statistics for a long time and enjoys R programming, I created this to help out a little with my knowledge since there aren't many good materials in Korean available on the Internet. I hope my lectures will be helpful to some people who aren't familiar with R.
Anyone can learn anything. This is my homepage slogan and my motto. When studying statistics, or studying in general, there will often be moments when you feel frustrated by things you don't understand. Don't blame yourself. It's not because you're stupid or can't study, but it's probably because you didn't follow the right study order. Rather than thinking that you can't do it, figure out which part of your study is missing and try to fill it. I wish you success.
Who is this course right for?
Anyone who draws a graph for a paper in Excel?
Those who have already tasted the basics of R
If you use ggplot but are always confused
Need to know before starting?
You can just look at the R code, follow it, and then run it to check the results.
Understanding R basic code - data frame, basic if statement syntax
7,205
Learners
178
Reviews
42
Answers
4.8
Rating
5
Courses
통계를 공부하면서 제가 배운것들, 깨닫게 된 것들을 제가 걸어왔던 길을 걷고 있는 여러분께 공유하고자 합니다. 몇몇 사람들에게는 궁금증이 해소되는 유익한 강의가 되기를 바랍니다. 또한, 예전의 저의 길을 걷고 있는 분들에게는 먼저 걸어간 저의 자취가 조금이나마 위로가 되었으면 좋겠습니다.
이삭 드림.
슬기로운통계생활 대표
The university of Iowa, Statistics & Actuarial science 박사과정 (ABD)
성균관대학교 보험계리학 석사
성균관대학교 통계, 산업공학 학사
유튜브 채널: 슬기로운통계생활
All
6 lectures ∙ (1hr 24min)
All
17 reviews
4.7
17 reviews
Reviews 5
∙
Average Rating 4.8
Reviews 97
∙
Average Rating 4.2
Reviews 17
∙
Average Rating 5.0
Reviews 489
∙
Average Rating 5.0
Reviews 26
∙
Average Rating 5.0
Free
Check out other courses by the instructor!
Explore other courses in the same field!