Building a Python Trading Room for Quantitative Investing - Part 2
Do you want to create a tool that can help you with your real-world investments using Python? In this course, you will learn how to create an interactive web dashboard for financial data analysis for intermediate Python users and learn about pair trading strategies for in-depth quantitative work. We hope that you will be able to create your own useful analysis tools to help you analyze financial data more powerfully and make wise investment decisions.
I used to only use Excel and Jupyter, but I felt the need for a web-based analysis tool, so I signed up for the course. The lectures are really good. I'm learning a lot!!
5.0
박경민
100% enrolled
It was good
5.0
mintae
100% enrolled
thank you
What you will gain after the course
Create an interactive web dashboard that lets you observe multiple function results simultaneously using Python
Long & Short Strategy: Introduction and Implementation of Pair Trading Strategy among Statistical Arbitrage Techniques
Financial and data background knowledge you must know when investing
How to use Plotly, a Python module that lets you visualize data on the web
Knowledge for analyzing financial data using Pandas
Create your own trading tools
Make financial data analysis smarter! Don't miss out on techniques that will help you in real-world investing.
Level up your stock analysis Attention those in need! 📈
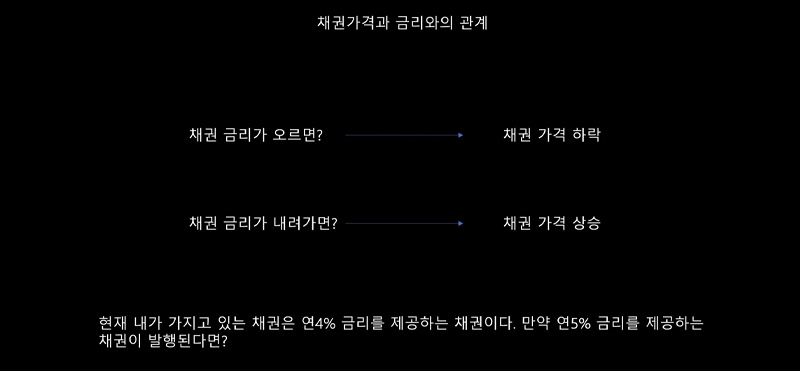
When investing, you are bound to have various questions. Which sectors should I invest in when interest rates rise? When interest rates rise, does the banking sector necessarily rise as well?
How do actual sectors change as various macro data moves? I need a tool that can observe whether things are moving the way I think they are or the opposite. It is inconvenient to observe this behavior by changing the parameters and re-running it every time.
At this time, if there is a dashboard that allows me to observe complex and diverse indices and immediately check the results I want , it can play a sufficient role.
Create an interactive dashboard to help you invest effectively! I hope this course will help you become more comfortable and familiar with financial data analysis.
In Part 2 🚩
Oh, is this perhaps your concern? 💡
I did learn Python though I don't think I'm using it properly.
Helpful for actual stock investment Are there any data analysis tools?
For those who are familiar with Python programming and basic time series data analysis, we will create a tool that can be helpful for practical investment using Python .
In Part 1 of "Building a Python Trading Room for Quantitative Investment," we learned how to create the functions necessary for analyzing financial data. Now that you've mastered basic programming and data analysis techniques, it's time to move on to solving more complex problems in Part 2. Create a dashboard that's truly useful for your real-world investments!
Analysis tools for real-world investing, With my own hands! 🛠️
Python Web Interactive Dashboard (Data visualization library Plotly + Dashboard building framework)
Using ETF data Statistical Arbitrage - Pairs Trading (Long & Short Investment Strategy)
Helpful for investment With data and finance background knowledge Understanding Financial Data Movements
Learning content Check it out.
Project 1: Creating a Web Interactive Dashboard for Top-Down Investing
PlotlyDashDash Callback
“Can’t we create a tool that can observe the movements of stock indices and the sectors that make them up (semiconductors, construction, banking, consumer goods, chemicals, electric vehicles, etc.) according to the movements of macro variables such as the won/dollar exchange rate, copper, oil (WTI), interest rates (Rate), gold (Gold), VIX…?”
I'm creating a tool that allows me to observe how the sectors I'm investing in, or intend to invest in, are affected by the movements of macro variables that are currently trending in the financial market. To create something that changes based on the movements of multiple variables, I need a tool that can change the variables in a function multiple times and observe multiple functions simultaneously. To create such a tool, I'm creating a web dashboard that uses Python to output the desired results to a web page, input the function variables into the web page, and view the changing function results without having to re-run Python. This dashboard allows you to conveniently observe various data and function results on a web page.
ETF? In this lecture, we will use ETF Close Price Time Series Data to observe the movements of macro variables. ETFs are products that track the movements of individual products, providing data that accurately reflects the movements of each product. As financial markets evolve and a wider range of products are launched, the variety of ETFs is also increasing. While the product range is still limited, it is expected that Korean ETFs will gradually become as diverse as those in the United States. Using ETFs reduces the effort of retrieving data from various websites to access diverse macroeconomic data.
Project 2: Creating a Pairs Trading Dashboard
StationaryADF (Augment Dicker-Fuller) TestZ-Score
“Can’t we learn a strategy that selects Long (buy) and Short (sell) targets through a statistical verification process and then receives signals to make investments?”
For our second project, we'll learn about pairs trading, a form of statistical arbitrage. We'll establish the statistical assumptions necessary to establish pairs (target securities), select pairs that meet those assumptions, and then develop a long-short strategy.
In the previous Part 1 lecture, we created a beginner-level index. In this lecture, we've chosen a quantitative strategy, aimed at intermediate users who require a thorough understanding of financial data and a grasp of the underlying phenomena. This strategy is widely used in algorithmic trading and, more recently, is being used to identify patterns through machine learning. I wanted to demonstrate that this concept is a widely used strategy in financial algorithmic trading. Through pairs trading, we'll develop a strategy that cannot be achieved with a single asset.
Have you been investing solely to profit from trends, buying single stocks? Now, let's learn about spread strategies through pairs trading. Spread trading is a widely used strategy in the financial sector, with the long-and-short strategy being a prime example. Since it's difficult for individuals to establish a short position, let's try pairs trading using ETF data. By implementing various strategies and directly observing phenomena occurring in financial data, you'll gain a deeper understanding of the underlying movements of financial data.
Data and financial background knowledge to help you invest
Top & Down Approach InterestRateVIXSales and Cost of Sales
“I want to improve my understanding of financial data. Is there a way to learn more about the background knowledge related to data and finance , and why specific data is used?”
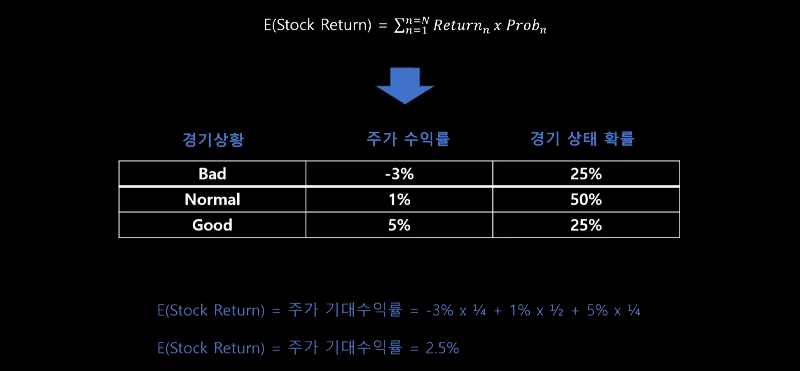
While quantitative analysis methodologies are important in data analysis, I believe understanding the data itself is paramount. The goal of this lecture is not simply to create financial data analysis tools, but to develop our own investment analysis tools. Furthermore, a deeper understanding of financial data will enable us to create more useful investment analysis tools. Simply attempting to present results solely through numbers will inevitably stray from practical investment practice. Therefore, a solid background knowledge that allows us to understand the dynamics of financial data is essential.
In this lecture, we've prepared a separate section on Finance Background. While there are no right answers in finance, we've prepared a section based on the lecturer's personal perspectives gained through his investment career. In this lecture, we'll explain why and how we used this data, and why it should be used.
Of course, finance is a complex and dynamic world, so it can't be explained in a clear, dichotomous way. However, I believe there's a significant difference between developing your own logic and analyzing financial data, and not doing so. I want to share this perspective with you. I hope that by developing your own perspectives on interpreting financial phenomena, you can develop even more useful financial analysis tools.
Created a lecture A word from a knowledge sharer🎤
Hello! This is ownCode. I've spent a lot of time preparing this course, hoping that it will help students analyze financial data more deeply and develop their own useful investment tools. I hope this course will help you create your own useful investment tools, make wise investment decisions, and understand financial data better.
Frequently Asked Questions 💬
Q. Is there any prerequisite knowledge required to attend the lecture?
This course is an intermediate-level course designed for financial data analysis using Python. Therefore, it's intended for those with basic Python programming knowledge and some experience with financial or time-series data. To take this course, you should have basic knowledge of the Pandas Python module. You should also be able to create functions in Python and have a basic understanding of its syntax. This course is designed with the assumption that you already have this knowledge.
This lecture will not primarily focus on the content from Part 1 of "Building Your Own Trading Room for Quantitative Investing ." The curriculum was designed to deliver content as different from Part 1 as possible. However, when creating projects in the lecture, I used Drawdown, RSI, and MACD. Since these concepts were covered in Part 1, they will not be covered separately in this lecture.
Q. How much mathematical knowledge is needed to understand Pairs Trading?
In this lecture, we've omitted any mathematical explanations of pairs trading. The key is understanding the concept behind the strategy and the underlying phenomena that led to its adoption. Understanding the mathematical and academic aspects of pairs trading requires a background in time series theory, as well as probability and statistics. These concepts will be covered in detail in subsequent lectures.
This lecture focuses on the phenomenon itself and the background behind the use of these strategies, rather than the mathematical details. Therefore, no mathematical knowledge is required.
See related lectures together 📺
Recommended for these people
Who is this course right for?
Creating a Python Trading Room for Quantitative Investing - Part 1
For those who want to create a Web Dashboard using Python
For those who want to learn Pair Trading strategy during statistical arbitrage
For those who want to create an Interactive Dashboard for Top-Down Investing
Those who want to devise various strategies by understanding the background knowledge of financial data
Need to know before starting?
Python
Building a Python Trading Room for Quantitative Investing - Part 1
I used to only use Excel and Jupyter, but I felt the need for a web-based analysis tool, so I signed up for the course. The lectures are really good. I'm learning a lot!!
Warm Coral
Thank you so much for your warm class review
In Part 3, we will film the lecture so that we can express many things on the web
Thank you for taking the class!


![[Inflearn X Opentutorials] HTML and InternetCourse Thumbnail](https://cdn.inflearn.com/public/courses/335806/cover/88d920fe-0c13-484f-8d31-1f1be0c6c4e0/335806.png?w=420)


![[Inflearn X VMware Tanzu] Spring Boot Meetup with Josh LongCourse Thumbnail](https://cdn.inflearn.com/public/courses/334969/cover/60f9ac96-0c89-4349-9f65-e97dea19aec5/334969.png?w=420)


![[Renewed] Python Machine Learning Bootcamp for Beginners (Easy! Learn by Solving Real Kaggle Problems) [Data Analysis/Science Part2]Course Thumbnail](https://cdn.inflearn.com/public/courses/327464/cover/55c4db7b-7764-43cc-ac75-d9e8d08098f1/327464-eng.png?w=420)