In a jiffy with Python programming, Create your own data analysis tool!
securities analysis , Does this sound like a distant dream? 📊
Stocks are something that a lot of people are doing these days! Have you checked to what extent the price of the stock you bought has fallen in the past? How are the technical analysis indicators that people use most created?
These days, interest in data-based quantitative investment is heating up. They say that the programming language Python can be used for data analysis. ThenI also wonderif Python can be used for financial data analysis .
Financial data analysis, which used to sound like a distant dream, could be done directly with Python and Excel. After creating technical indicators directly in Excel and Python and identifying areas for improvement, How about creating your own indicator and using it in your trading? Wouldn't a much more strategic investment be possible?
Create a function that can analyze domestic stocks, ETFs, and other financial data all at once using Python! This course will help you implement your ideas directly in Python.
Only in this lecture Key Points ✨
Directly with Python Implement your own ideas
The characteristics of the data The power to understand and analyze
My own Creating analysis metrics
Functional programming and How to become friends
You too, directly You can make it ✅
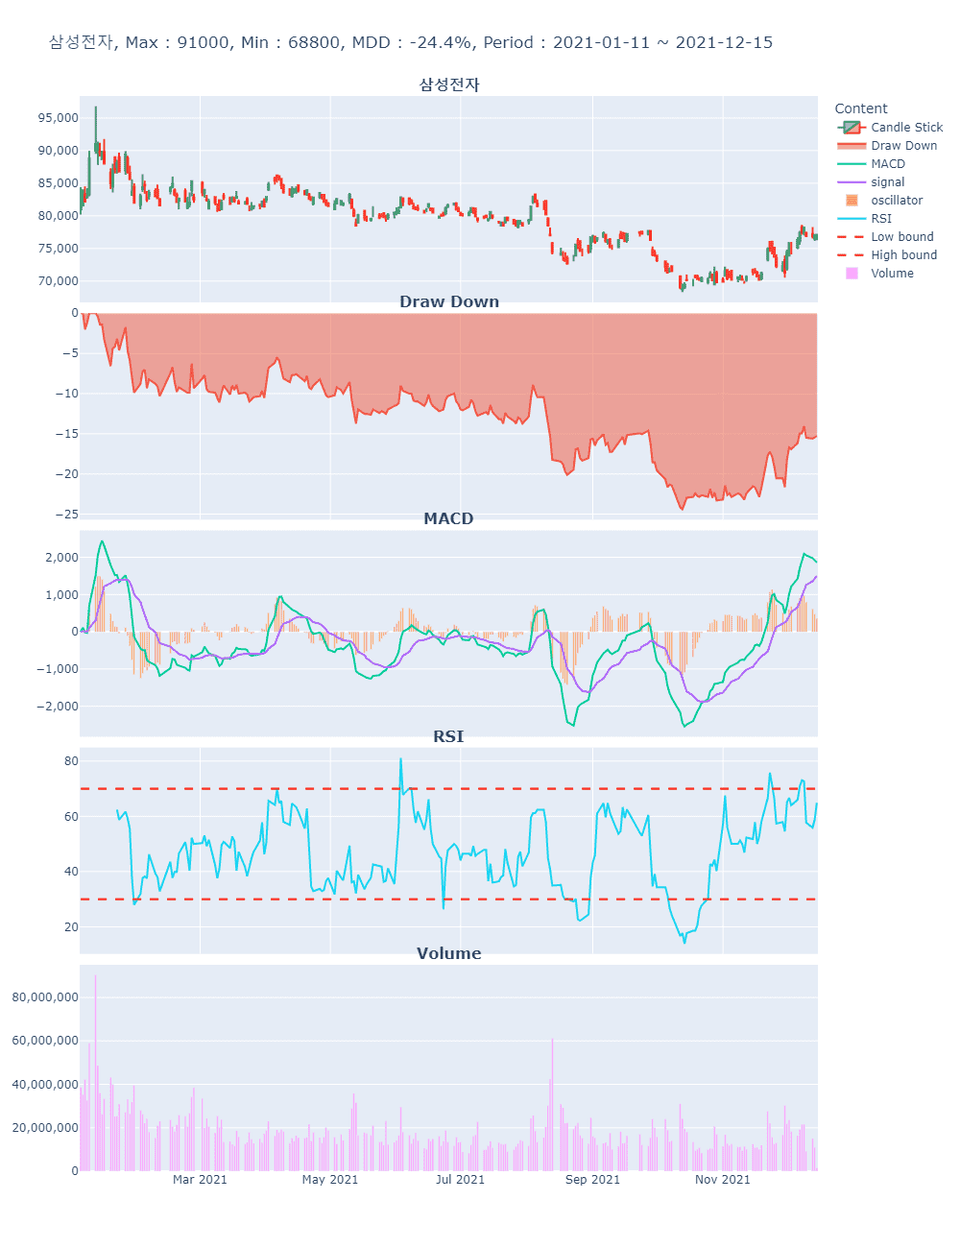
Samsung Electronics (individual stock example)
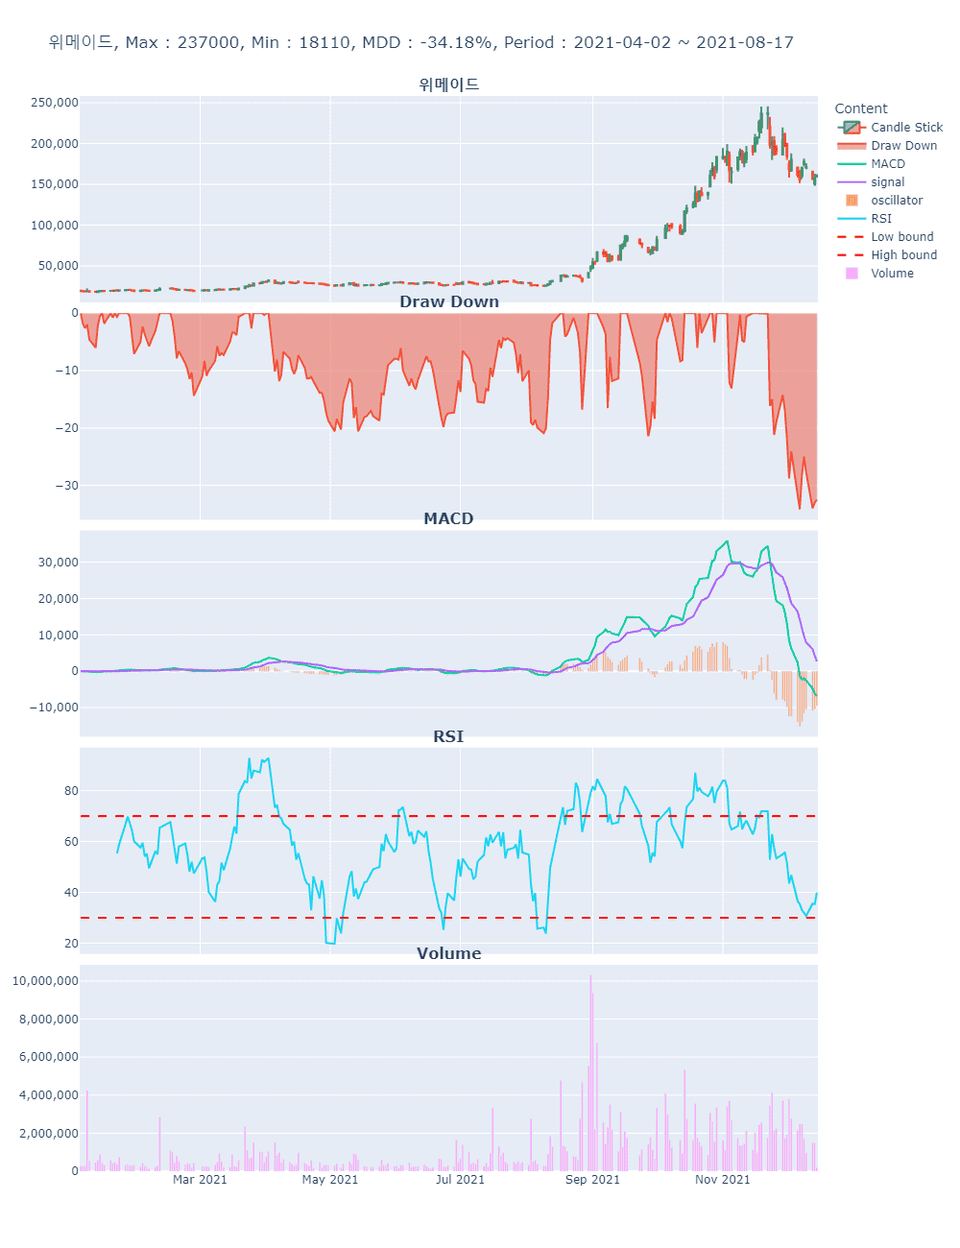
Wemade (individual stock examples)
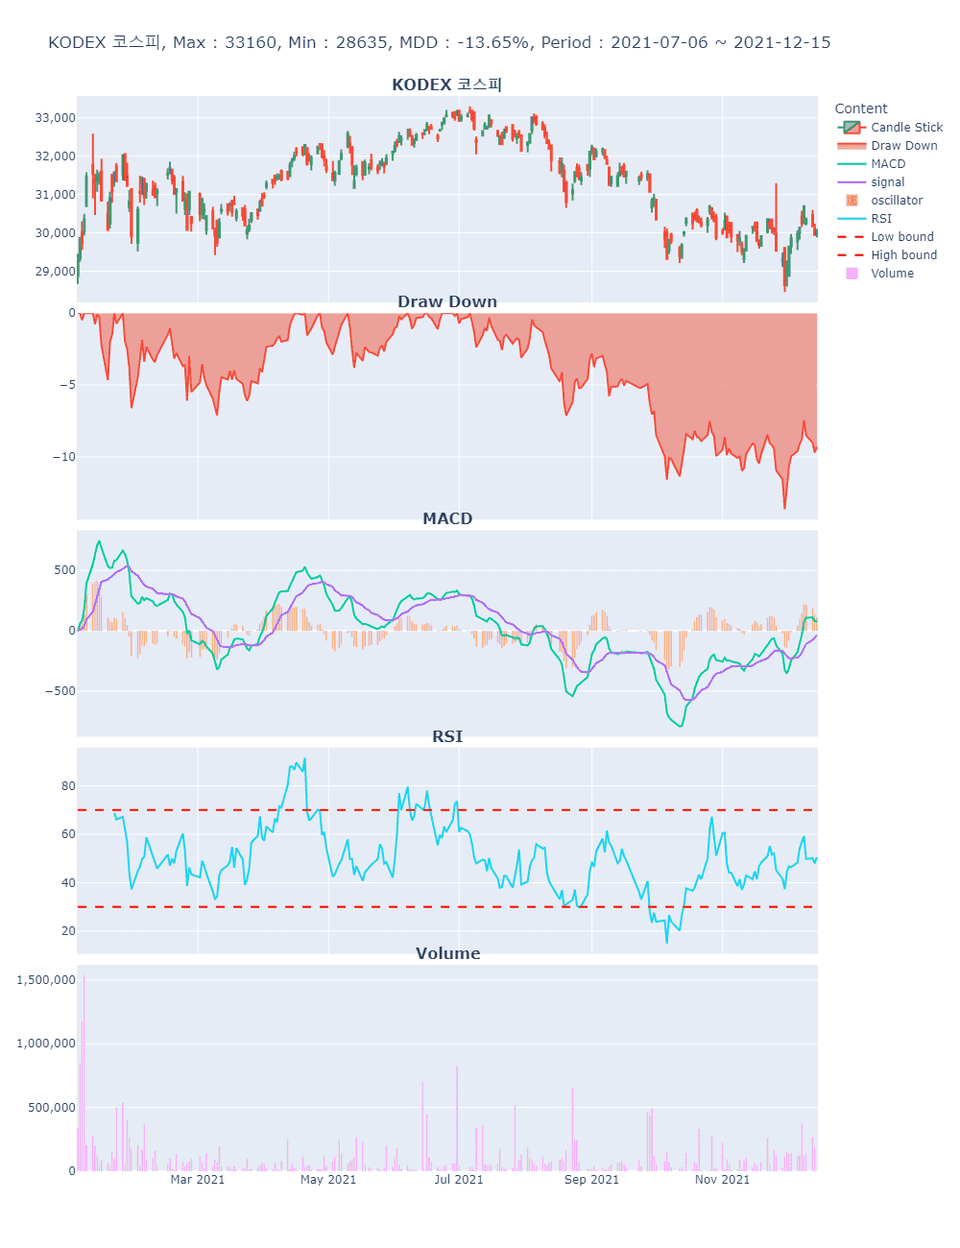
KODEX KOSPI (ETF example)
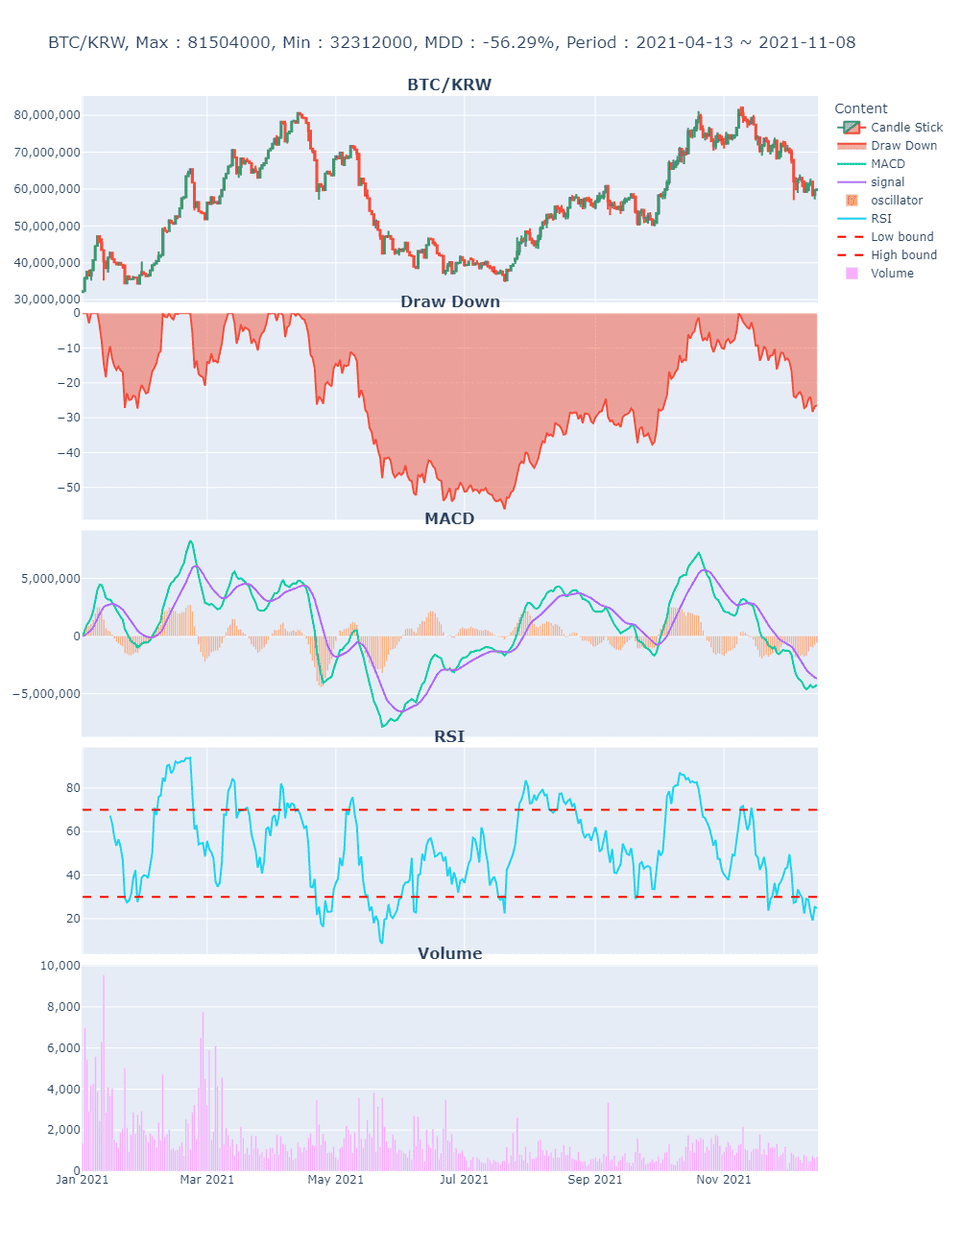
Bitcoin (BTC/KRW)
Key Features of This Course 📌
The purpose of this lecture is not to share the project's results. The project's results are my own example, and the purpose of the lecture is to help students understand the results so they can create their own results. Develop the power to design projects with your own ideas and implement them through programming!
✅ We explain the concepts required to create the project's results, divided into sections.
✅ Before implementing a project with Python, we will explain what you are creating through Excel and the whiteboard, and what you need to add your own individuality.
✅ For those who want to conduct advanced quantitative analysis using Python in the future, we build confidence by providing basic yet practical results.
Learning content Check it out 📚
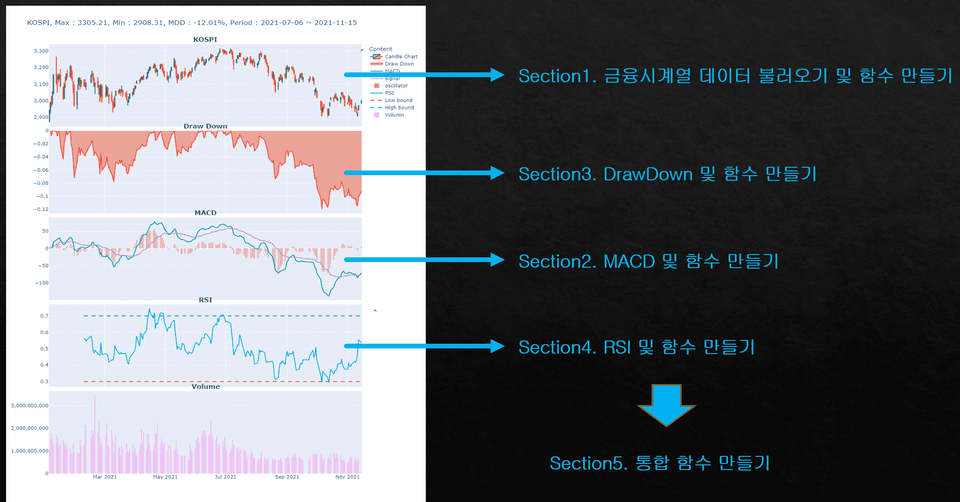
#1. Financial time series Importing data and Create a function
We'll load financial data using the Python module FinanceDataReader. Rather than simply using the module to load data, we'll create a function that allows you to easily load data by simply entering the name of the desired stock. We'll also write code to ensure the results are displayed immediately.
#2. MACD and Create a function
Let's not just look at the dictionary definition of MACD and write code! Before implementing MACD, let's examine the commonly used concept of "average." Is it appropriate to use a simple average or a moving average when analyzing time series data? Why use an exponential moving average? And what impact do the variables in each average have on actual analysis? This is the most important topic in Section 2.
#3. DrawDown and Create a function
The most commonly used rate of return in financial data? Do you know the difference between simple and compound interest? Even after investing time and effort in creating complex financial models, many mistakes are made due to incorrectly estimating the rate of return. Let's explore how to calculate and recognize the rate of return by creating a DrawDown.
#4. Creating RSI and Functions
The Relative Strength Index (RSI) is a widely used indicator. However, its results vary depending on how it's created. Should the average used to create the RSI be a moving average or an exponential moving average? There's no right answer, but it's a matter of user input. Rather than simply using code written by others, a perspective that allows you to tailor your code to the needs of your users is crucial.
#5. Creating an integrated function
We'll write a function that takes the results of the functions created in Sections 1-4 and computes the project's results. We'll then write an integrated function that allows us to see the results immediately by simply executing the function. By writing this integrated function, we'll explore the advantages of functional programming.
Created a lecture A word from a knowledge sharer 🎤
Hello! This is ownCode.
I designed this course with the hope of sharing the knowledge I use in my work and financial management. Data analysis may seem unfamiliar and distant, but I want to show you that it's not.
There's no right answer in data analysis, and even with identical results, each individual may reach different conclusions. I hope my knowledge and experience can help you make informed decisions.
Questions you may be curious about Check it out in advance! 💬
Q. How much Python knowledge do I need?
To facilitate this lecture, you should have a basic understanding of Python syntax. Experience with lists, dictionaries, if statements, for loops, and functions is sufficient!
Q. What makes this course different from other courses?
This course isn't about explaining dictionary definitions and implementing code. It's about explaining the concepts used to create indicators and helping you create your own indicators, rather than simply copying existing code.
Q. Do I need to know Pandas?
For those unfamiliar with Pandas, I've created a separate course on the subject. Pandas is an essential library for data analysis in Python. This course assumes some level of Pandas proficiency.
For those who are unfamiliar with or don't know how to use the Pandas library, I have created a Pandas lecture. Please take that lecture before taking this lecture.
I was impressed by the way the meaning of technical indicators was explained by connecting them with the writing of code, and the process of writing code and converting it into a function was very easy and natural, so I could feel that the instructor had put a lot of thought into the class. Thank you for listening!!


![[Inflearn X Opentutorials] HTML and InternetCourse Thumbnail](https://cdn.inflearn.com/public/courses/335806/cover/88d920fe-0c13-484f-8d31-1f1be0c6c4e0/335806.png?w=420)


![[Inflearn X VMware Tanzu] Spring Boot Meetup with Josh LongCourse Thumbnail](https://cdn.inflearn.com/public/courses/334969/cover/60f9ac96-0c89-4349-9f65-e97dea19aec5/334969.png?w=420)


![[PL 0303] Python for Data Visualization - Matplotlib Master ClassCourse Thumbnail](https://cdn.inflearn.com/public/courses/336172/cover/80fa86e7-dcb6-4b0f-b15b-323b6fa32809/336172.png?w=420)
![[Renewed] Python Machine Learning Bootcamp for Beginners (Easy! Learn by Solving Real Kaggle Problems) [Data Analysis/Science Part2]Course Thumbnail](https://cdn.inflearn.com/public/courses/327464/cover/55c4db7b-7764-43cc-ac75-d9e8d08098f1/327464-eng.png?w=420)

![[Side Project After Work] Big Data Analysis Certification Practical Exam (Type 1, 2, 3)Course Thumbnail](https://cdn.inflearn.com/public/courses/329972/cover/dcfb28fd-48c1-4bb1-ab31-d59eac874194/329972-original.png?w=420)