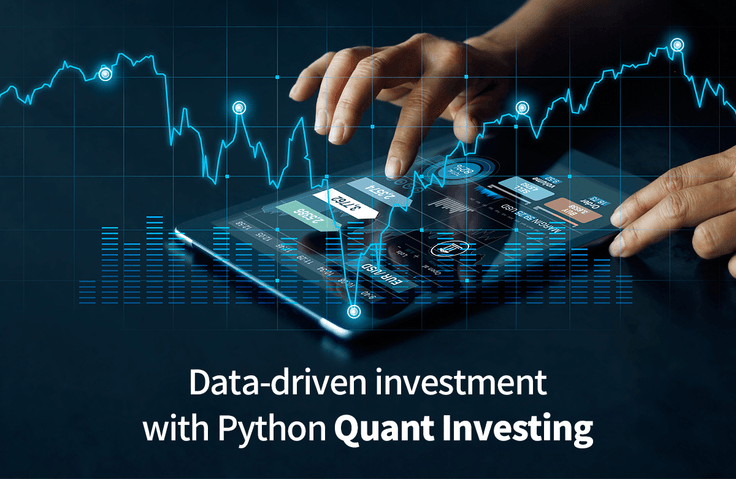
Data-Driven Investment Methods for a Lifetime with Python Quant Investing
Build data-driven investment strategies with Python quant investing and put them into practice. You can implement various asset allocation strategies and ultimately create your own unique investment strategy.
This course is related to monetization/side business. Results may vary by individual, so please consider your purchase carefully.
Reviews from Early Learners
4.9
5.0
김정빈
100% enrolled
Thank you for your effort
5.0
hakjuknu
98% enrolled
Great!
5.0
dukim
62% enrolled
The lecture is not boring and fun. It explains backtesting and visualization of asset allocation, and it is easy to understand because it is explained very well. These days, many people are saving pensions and doing personal IRP, so it would be good to try backtesting and invest directly. Since many good domestic ETFs have been released recently, I calculated the CAGR and MDD by applying the exchange rate to the corresponding overseas ETF and determined the investment ratio.
What you will gain after the course
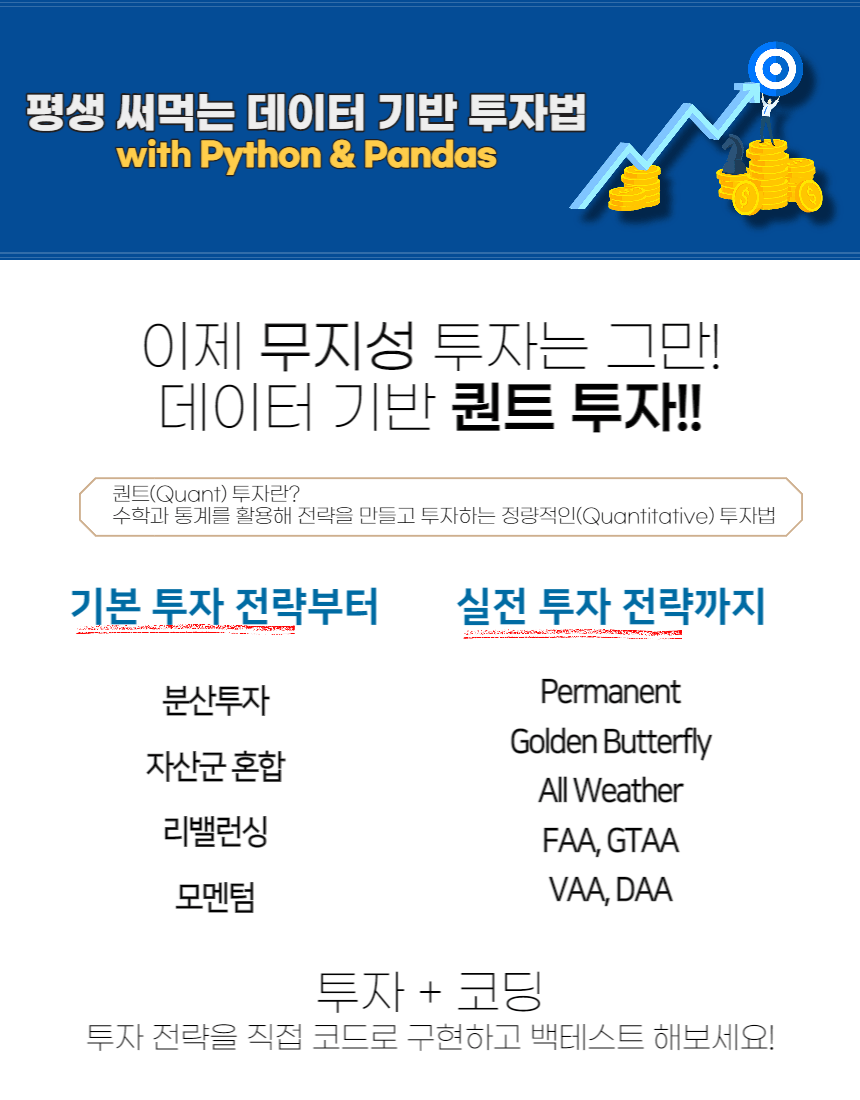
Python & Pandas + Investment Techniques Using Financial Data
The ability to establish your own investment hypothesis and execute data-driven simulations (Back-Test)
Various practical investment strategies and quantitative performance measurement methods (CAGR, drawdown)
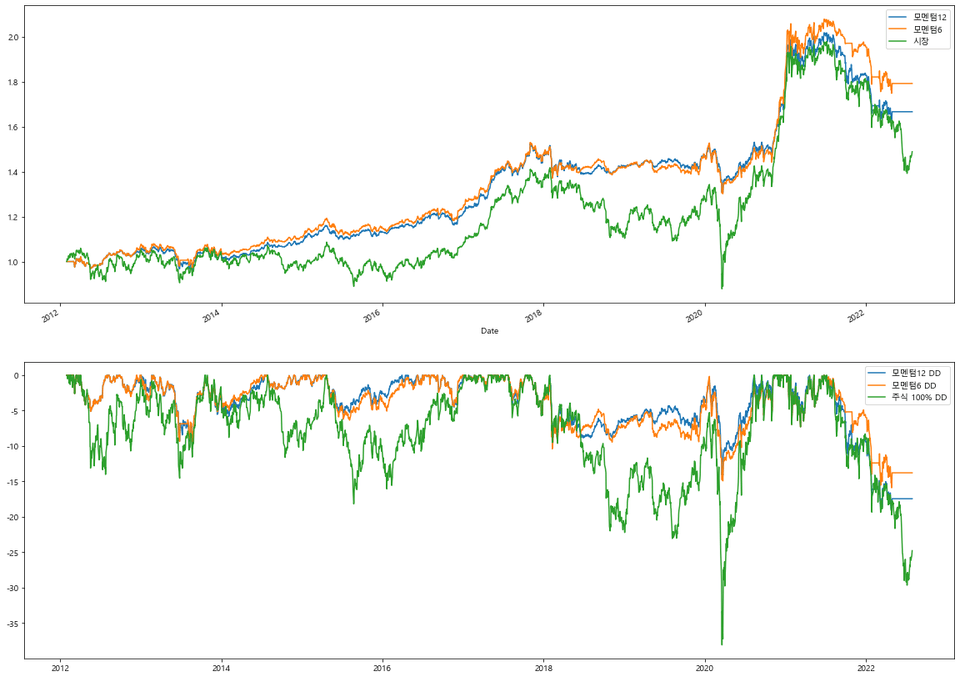
Implementation of systrader79's Average Momentum Score investment strategy
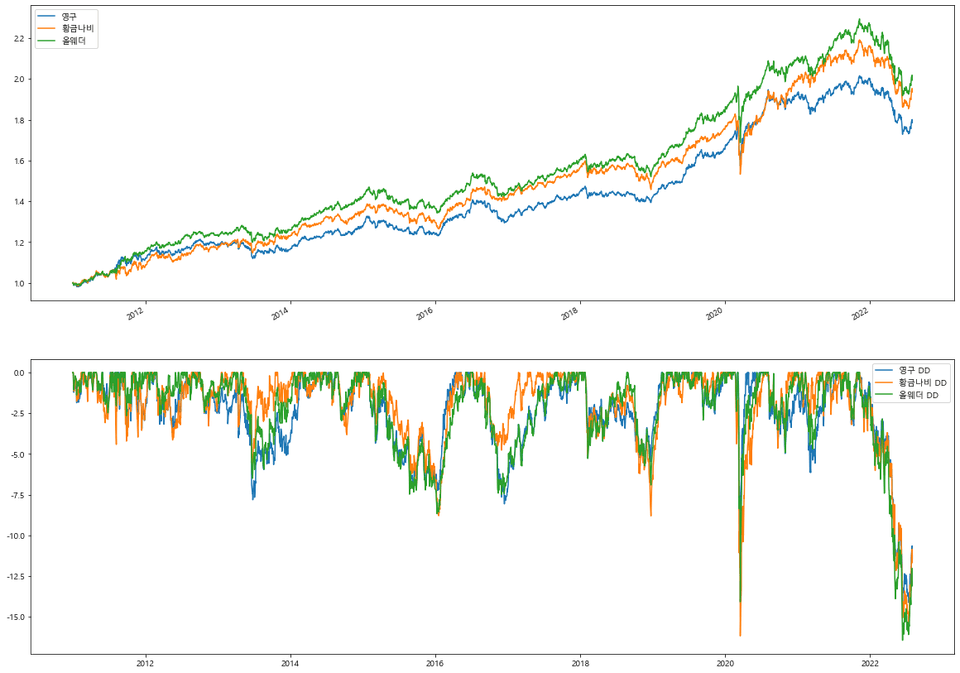
Implementation of static asset allocation techniques (Permanent, Golden Butterfly, All Weather)
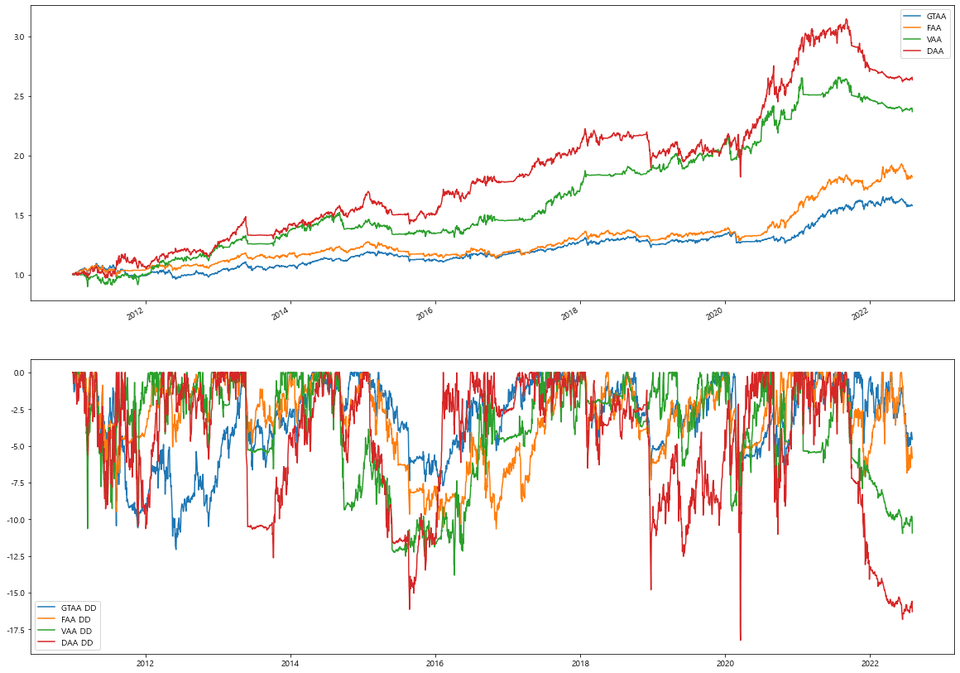
Implementation of Dynamic Asset Allocation Techniques (GTAA, FAA, VAA, DAA)
Investment methods for ordinary people? 👀
Many people already know that financial management is essential. So, they followed others into stocks and crypto, but why is it that stocks always seem to drop the moment I buy them? Is there no way for an ordinary person to make money through investing?
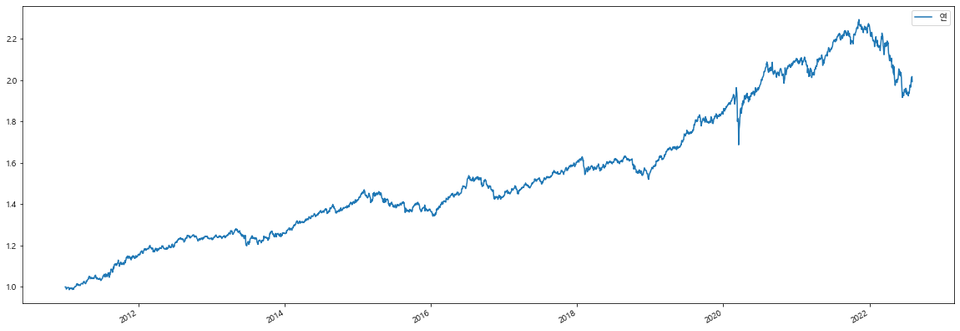
Investing is not about making a large sum of money all at once. You need life-long investing that can hedge against inflation and protect your precious assets from a long-term perspective.
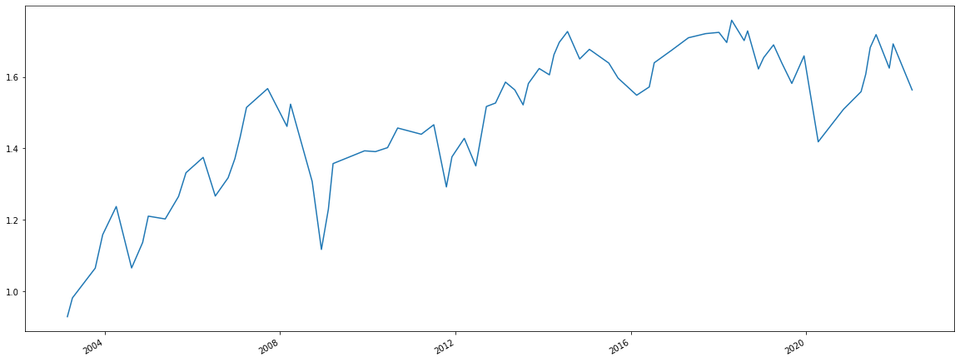
[Example of long-term upward investment returns. All Weather Portfolio]
The main reason most people fail at investing is that they make investment decisions without any criteria, often swayed by news or the opinions of those around them. However, for those of us living busy daily lives, it is extremely difficult to evaluate value and invest through in-depth corporate analysis. Therefore, I propose a quantitative investment method, known as Quant investing, rather than a qualitative approach.
Quant Investing, I Want to Know More 💫
The biggest advantage of quant investing is that it provides objective investment decision criteria based on data. By utilizing quant methods, you can make investments backed by solid evidence.
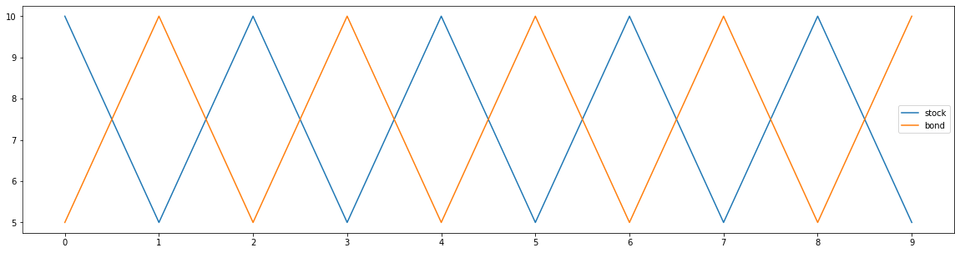
Everyone knows that to succeed in investing, you must buy low and sell high. Let's look at an example. The price of stock A has fallen lower than the price I checked a few days ago. Then, I judge this to be cheap (a subjective judgment) and bravely make a purchase. Of course, if you're lucky, you might make a profit, but the data tells a different story.
Experiment 1
Buy when it's cheap (falling) and sell when it's expensive(rising)
Experiment Period: 2002.11~2022.07
Experiment Subject: KOSPI 200
Buy condition: Today's stock price <= 20-day low (I will buy when the stock price is cheap.)
Selling condition: Today's stock price >= 20-day high (I will sell when the stock price is expensive.)
Cumulative Return 1.56 (56%)
The strategy of buying low and selling high yielded a 56% return over approximately 20 years. When converted to an annual interest rate, this amounts to a compound annual growth rate (CAGR) of about 2.3%. This is similar to savings account interest rates. Considering the labor involved in checking the 20-day highs and lows to trade for 20 years, it doesn't seem like a very satisfying return.
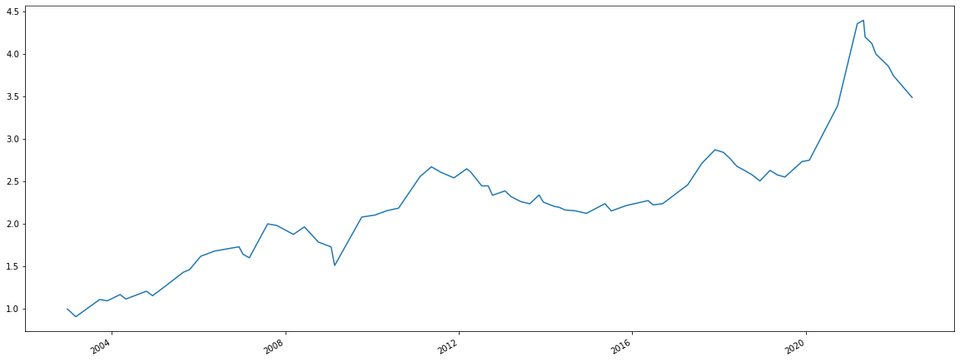
Experiment 2
Buy when it's expensive (rising) and sell when it's cheap (falling)
Experiment Period: 2002.11~2022.07
Experiment Subject: KOSPI 200
Buy condition: Today's stock price >= 20-day high (I will buy when the stock price is expensive.)
Sell Condition: Today's stock price <= 20-day low (I will sell when the price is cheap.)
Cumulative Return: 3.48 (348%)
It is amazing. Compared to the 56% return in Experiment 1, we achieved a 348% return in Experiment 2. When converted to an annual interest rate, this is equivalent to earning an annual compound return of approximately 6.4%. At this level, I believe it has sufficiently covered the labor costs of checking the minimum and maximum prices for trading over the past 20 years.
As you have seen, utilizing quant allows you to invest based on data. It enables investing based on objective data and evidence, rather than investing based on subjective judgment. You will gain the ability to test your hypotheses before actually executing an investment.
We recommend this to the following people 😊
Those who want to develop an investment strategy that can be used in the long term
매번 직감으로 투자하여 손해본 경험이 있으신 분
평소 생각했던 투자 전략이 있지만 기술적인 한계에 부딪혀 포기하신 분
투자+코딩으로 데이터 기반 스마트한 투자 방법을 배우고 싶으신 분
What you will learn 📚
In this course, you will learn fundamental investment theories and strategies. You will learn how to implement various investment strategies developed by investment masters (All Weather, DAA, etc.) into code using Python and the Pandas library, and how to backtest them.
1. Concepts and Implementation Methods of Investment Performance Metrics
Day-Return, Cumulative-Return, CAGR, DD, MDD
Before looking into various investment strategies, we will learn about indicators used to measure quantitative performance.
2. Basics of Investment - Diversification
You've likely heard many times that you should diversify your investments, but have you ever personally tested the difference between when you do and when you don't?
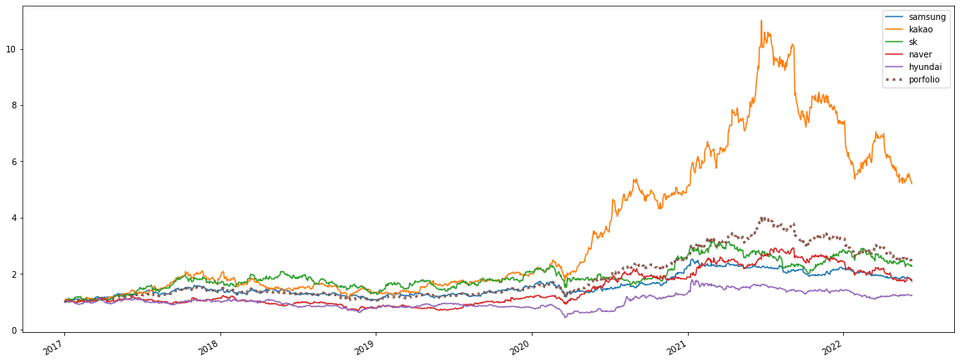
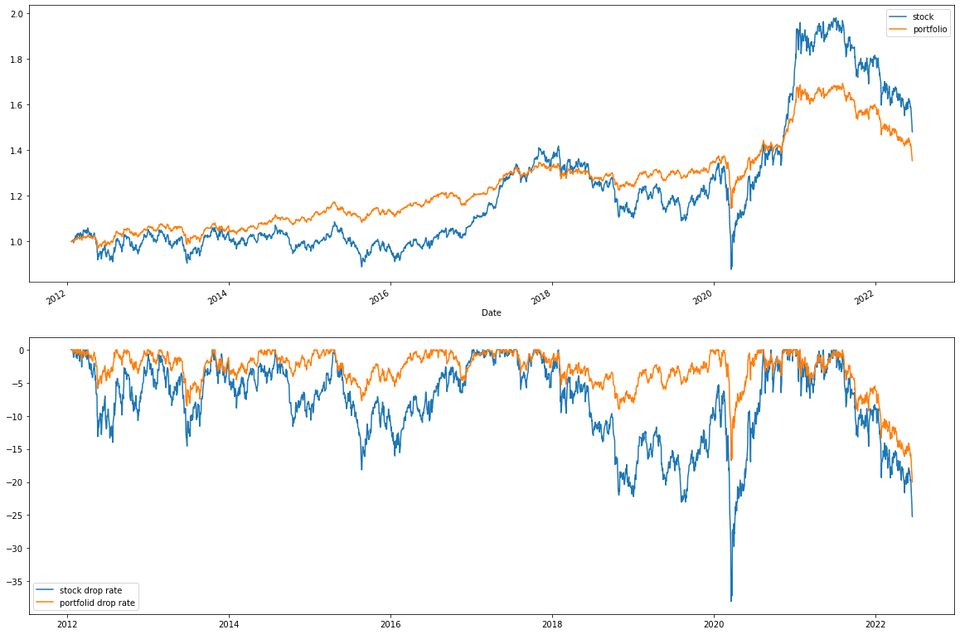
Samsung Electronics All-in vs. 5 Large-cap Stocks Diversified Investment Results
3. Basics of Investing - Mixing Bonds
One of the reasons people cannot sustain stock investing for a long time is because of the extreme volatility.
What kind of changes would occur if you mix in bonds?
4. Basics of Investment - Rebalancing
They say that simply buying and holding stocks is not always the best approach.
Theoretically, it is said that periodic rebalancing to maintain target ratios can lead to better performance by executing selling high and buying low. Check the results through actual data.
5. Basics of Investing - Trend Following
As seen in the 20-day high/low trading experiment, stock prices exhibit trends, and investing accordingly has yielded good results.
Even within trend-following techniques, various methods exist, such as absolute, relative, and dual momentum.
Among them, we will implement the Average Momentum Score strategy introduced by systrader79.
Now that we have learned the basic investment strategies to some extent, it is time to implement the asset allocation strategies that will be used in practice.
We will implement the Permanent, Golden Butterfly, and All Weather portfolios and compare their performances.
Similarly, it is now time to implement dynamic asset allocation strategies that can be used in actual trading.
Implement the GTAA, FAA, VAA, and DAA strategies and compare their performances.
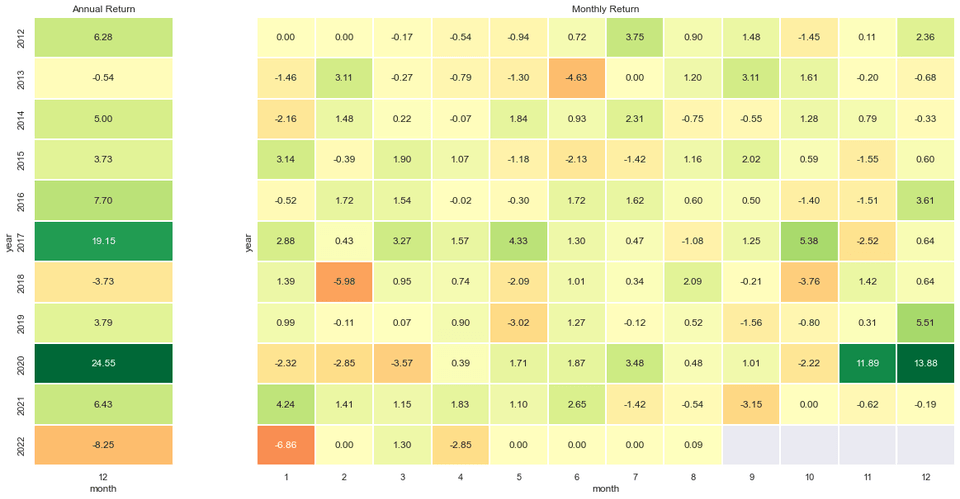
8. Visualizing Returns by Period
Actual investment will take place over several years.
Therefore, it is also important to understand the recent performance of each strategy.
We will also learn how to organize and visualize recent returns by month and year.
Changes in students after taking the course 📜
You can explain why managing risk is more important than achieving high returns for sustainable investing.
You can understand and explain the theoretical basis for diversification, asset class mixing, rebalancing, and trend following.
You can retrieve and utilize financial data using Python.
You can understand various dynamic and static asset allocation strategies and implement them with Python code to perform backtesting.
You can create your own investment strategies by customizing the asset allocation strategies learned in the course.
You can now execute evidence-based investments grounded in data, rather than blindly following others.
Q&A 💬
Q. What Python development environment do you use?
We use Jupyter Notebook! It is convenient to install it via Anaconda.
Q. Can I take the course even if I don't know the basics of Python and Pandas?
The course proceeds under the assumption that you have a basic understanding of Python programming syntax and Pandas. If you need to learn the basics of Python and Pandas, please refer to the latter part of the curriculum!
Q. Isn't quant something difficult that only science and engineering students can do?
If you have ever encountered basic middle/high school level statistics such as mean, variance, and normal distribution, and have invested in stocks at least once, you are at a sufficient level to follow this course.
Q. Is this a lecture on creating an automated trading program?
No! This course focuses on asset allocation strategies based on data analysis. It is different from swing trading or scalping, which have very short trading cycles. The quant program we will use calculates investment weights at the end of each month, quarter, or year according to the investment strategy. You can then place the trades yourself through a brokerage based on those weights! I also plan to create a course on short-term automated trading programs in the future :)
Recommended for these people
Who is this course right for?
Someone who has never properly learned financial management but wants to learn smart investment methods after experiencing investment losses.
Those who want to learn logical and systematic investment methods using coding and data
Those who are familiar with Excel and programming and want to turn those skills into investment techniques.
People who want to research their own investment strategies and engage in actual investing
Those who want to make investments that trend upward over a long period of time, rather than a one-time "get rich quick and get out" investment.
Pandas Basic Syntax (series, dataframe and its associated concepts)
Middle/high school level mathematics, probability, and statistics knowledge (not extremely high difficulty, but basic mathematical ability required for calculating returns and implementing portfolio logic).
I will create development content that anyone can enjoy and learn from.
Experience ✒️
Served as a code reviewer for the 6th cohort of the Naver Connect Boostcamp Web Backend (Node.js) program
Seoul Business Agency SeSSAC Online IT Content Partner (Full Stack)
Conducted the Seoul Business Agency (SBA) SeSSAC Developer Introductory Course (Python, JavaScript)
Conducted lectures for the Konkuk University Immersive Programming Course
Head of Server Division, Seoul SSAC Rising Programmer
Outsourced development of cryptocurrency automated trading program (Qt)
Marketing agency landing page development outsourcing (Web)
Outsourced development of real-time data processing Windows application (Qt)
Outsourcing development of an automated cryptocurrency trading program (Qt)
Outsourcing development of a marketing agency landing page (Web)
Outsourcing development of a real-time data processing Windows application (Qt)
The lecture is not boring and fun. It explains backtesting and visualization of asset allocation, and it is easy to understand because it is explained very well. These days, many people are saving pensions and doing personal IRP, so it would be good to try backtesting and invest directly. Since many good domestic ETFs have been released recently, I calculated the CAGR and MDD by applying the exchange rate to the corresponding overseas ETF and determined the investment ratio.


![[Renewed] Python Machine Learning Bootcamp for Beginners (Easy! Learn by Solving Real Kaggle Problems) [Data Analysis/Science Part2]Course Thumbnail](https://cdn.inflearn.com/public/courses/327464/cover/55c4db7b-7764-43cc-ac75-d9e8d08098f1/327464-eng.png?w=420)