.png?w=960)
Getting Started with Programming: Introduction to Python (Inflearn Original)
inflearn
$26.40
Beginner / Python
4.8
(1,336)
33,900+
The best introductory programming course that has already been taken and enjoyed by over 20,000 people. This introductory programming course was planned and prepared by Inflearn from the perspective of a non-major, and helps people who have never touched programming before to develop programming skills that can be used in real life.
Beginner
Python

![[Inflearn] From Course Creation to Promotion: A Journey of Knowledge Sharing with InflearnCourse Thumbnail](https://cdn.inflearn.com/public/courses/334097/cover/63a94b3a-104c-4ba4-a607-46342a334eb6/334097.png?w=420)
![[Inflearn X Opentutorials] HTML and InternetCourse Thumbnail](https://cdn.inflearn.com/public/courses/335806/cover/88d920fe-0c13-484f-8d31-1f1be0c6c4e0/335806.png?w=420)

![[2024 Update] Getting Started with UX/UI: Introduction to Figma (Inflearn Original)Course Thumbnail](https://cdn.inflearn.com/public/courses/332714/cover/325726bf-0b00-4e09-8b39-519824910a9d/332714.jpg?w=420)


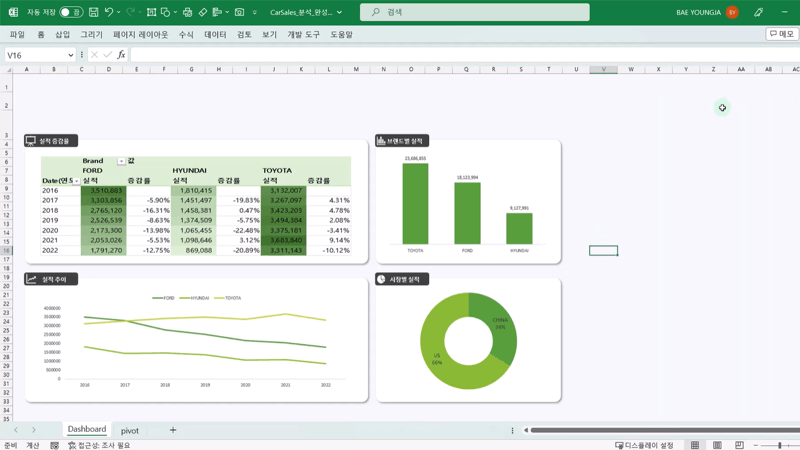
![[Pass ITQ Excel A in One Go] in 3 daysCourse Thumbnail](https://cdn.inflearn.com/public/courses/329652/cover/b44e11b6-a47e-4993-86ea-a85da9836bb5/329652-eng.png?w=420)