


Advanced ChatGPT Usage - ChatGPT Secret Class to Use 100x Better Than Others
Masocampus
AI will not replace people. But 'you utilizing AI' will replace all who don't.
입문
ChatGPT, AI, prompt engineering
This course will help you make the most reasonable business decisions through data, from data connection to data visualization. Completely master Power BI data analysis and visualization that will lead to valuable insights!

The ability to visualize complex data in an easy-to-read manner at a glance
Data preprocessing process that brings real results to your work
The ability to make the most rational business decisions through data
Ability to visualize data and gain insights through various explorations using Power BI
NO heading to bare ground!
Visualize your data quickly and easily 😉
In recent years, visualizing complex and massive business data in an easily understandable way, enabling each person in each role to derive useful insights, has emerged as a critical issue in corporate data management. This is because the volume of data accumulating both inside and outside the company has increased, yet few employees, other than a few data analysis experts, possess the capabilities to achieve tangible results.
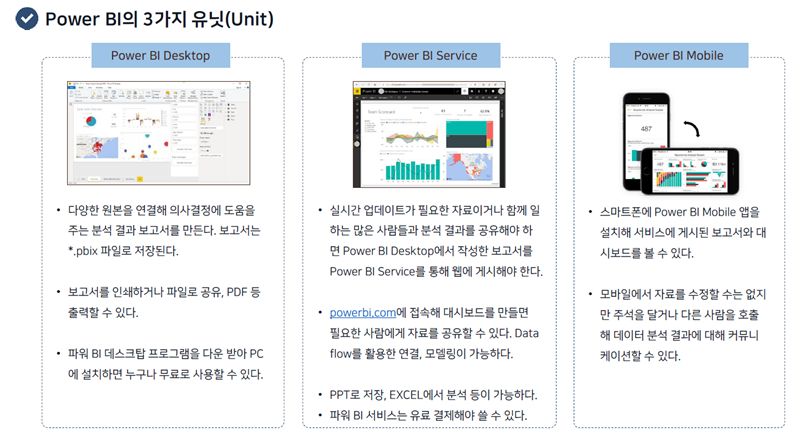
That's why Power BI is so important! Power BI is a data utilization tool that allows anyone to easily view all their data, anywhere, in any way they want, at a glance . Power BI is similar to Excel, but is more specialized for data design and visual analysis. This course focuses on general concepts and basic usage, allowing you to create results that feel like you've worked with a professional designer.
Why Power BI? 🤔
📢 Please check before taking the class!

Those who are at a loss as to how to process data in practice

For those looking for a tool that can easily visualize large amounts of data

Those responsible for tasks that require important data preprocessing

Those who want to learn skills that can be applied immediately in practice
This course will teach you how to effectively utilize complex and massive business data using Power BI.
The biggest reason practitioners find data visualization difficult is the sheer number of analytical tools available and the perceived difficulty of learning languages like Python and R. However, the core of data analysis isn't the "tools." It's the "analytical skills" that enable you to understand and analyze data to uncover insights.
This course moves beyond the difficult tool learning methods reserved for specialized occupations or experts, enabling you to perform professional visualization and data analysis using Power BI, an easy-to-use analytics tool.
You can create unexpected value from all types of data, including not only numerical data like sales data, but also categorical data and time series analysis.
Power BI features built-in machine learning analytics, enabling you to transcend the limitations of human intuition and time, even facilitating empirical judgment. By bringing in data regardless of its format and source and visualizing it in a variety of ways, you can uncover its full potential and value. Through analysis and insight sharing tailored to the digital age, Power BI helps you make the most rational business decisions based on data.
This course will help you develop advanced visualization analysis skills using commonly available data. You'll analyze everyday product sales data and exchange rates from various perspectives, leveraging the numerous objects supported by Power BI.
However, the goal of our course isn't to provide a deep understanding of analytical tools or master their skills. All you need is a general understanding of the concepts and basic usage. With Power BI's interactive process, anyone can create results that rival those achieved by professional designers.
This course is recommended for those who want to fully extract data insights and make valuable decisions through high-quality visualizations that are easy to learn and instantly created.

Power BI Data Visualization Modeling
Common to all visualization objects
Utilize essential features

Interactive Dashboard
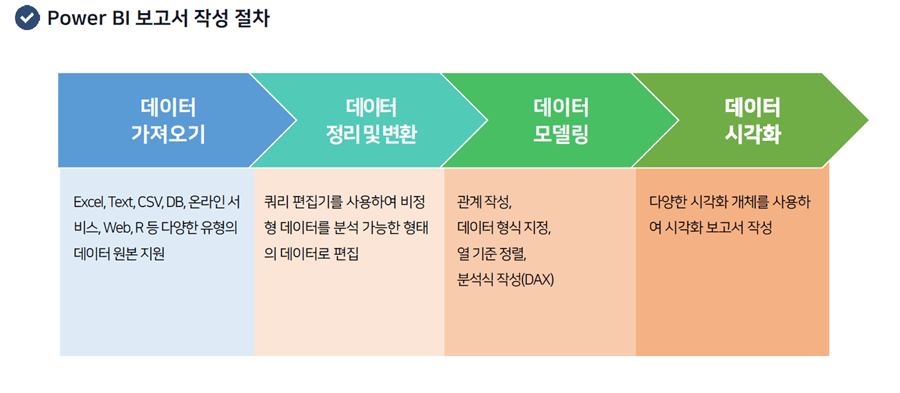
Loading, transforming and preprocessing data
Create various charts

DAX syntax that is highly useful in business
Time intelligence function and
Ability to handle conditional expressions

Visualization-based business data analysis
Provided by artificial intelligence analysis function
Leveraging business insights
1. Learn Power BI and the visualization process!
2. Understanding data visualization and modeling using Power BI Desktop
3. Try out some commonly used visualization techniques!
4. Various forms of visualization
5. Useful features for visualization
6. Practice applying visualization-based business data analysis
Q. Is prior knowledge of Power BI required?
This course doesn't require any prior knowledge of Power BI; all you need is a passion for developing your data analysis skills!
Q. Are there any requirements or prerequisites for taking the course?
Since this is a hands-on course, we recommend bringing a dual monitor or a spare device to separate the lecture and practice screens. Furthermore, since the practical training will be conducted on a Windows OS, we recommend taking the course in a Windows environment.

Who is this course right for?
For those who are at a loss as to where and how to start processing data in a practical dataset
For those looking for a tool that visualizes even large amounts of data in an easy-to-understand way
Workers whose job involves important data preprocessing
For those who want to learn skills that can be applied immediately to practical work
8,741
Learners
1,197
Reviews
108
Answers
4.7
Rating
95
Courses
"어제보다 성장하겠습니다. 그리고, 어제보다 성장하려는 사람을 돕겠습니다."
마소캠퍼스의 진심과 소망을 담은 Actionable Content로,
2013년부터 온오프라인으로 함께해 온 누적 강의 1억시간!
이 소중한 경험과 시간은 언제나 마소캠퍼스와 수강생 모두의 성장의 원천입니다.
마소캠퍼스 팀은 우리의 모두의 성장을 위해 두 가지 원칙을 반드시 지킵니다.
1. 배우면 반드시 쓸 수 있는 Actionable Content
2. 참여자의 시간과 수고를 존중하는 Time-Saving Curriculum
마소캠퍼스의 Actionable and Time-Saving Curriculum으로 성장의 길을 함께 걸어나가길 기원합니다.
All
56 lectures ∙ (19hr 39min)
Course Materials:
All
12 reviews
4.8
12 reviews
Reviews 5
∙
Average Rating 4.2
Reviews 1
∙
Average Rating 4.0
Reviews 1
∙
Average Rating 5.0
Reviews 1
∙
Average Rating 5.0
Reviews 9
∙
Average Rating 4.4
4
It is easy to understand because you teach it in a practical way. I will use it for reference for a long time.
Thank you for leaving a review! 😊 It makes all the hard work worthwhile. Maso Campus will always do its best!
Limited time deal
$70.40
29%
$100.10
Check out other courses by the instructor!
Explore other courses in the same field!


![[For Beginners] Data Visualization with Power BI강의 썸네일](https://cdn.inflearn.com/public/courses/327055/cover/455b54c1-3e63-439b-9b60-5d12e12bc303/PowerBI-001)
