Big Data Analyst Exam Practice (Python)
dee
Free
Basic / Big Data, Python
4.9
(119)
5,100+
This is a lecture on the National Technical Qualification Big Data Analysis Technician Practical with Python. We hope you all pass!
Basic
Big Data, Python
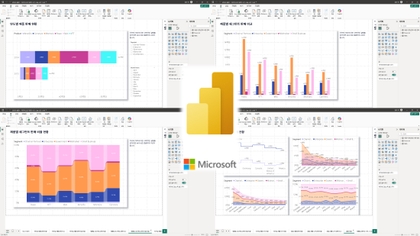
In the [Beginner's] Data Visualization with Power BI course, you will learn how to edit data using the query editor, visualize data using various tools, and check and share the analyzed results.
2,665 learners
Level Beginner
Course period Unlimited
.png?w=736)
Reviews from Early Learners
5.0
이동엽
Starting with this, I feel like I want to see more in-depth lectures~!
5.0
김민구
Good good good
5.0
심민지
This was a lecture where I could simply learn about Power BI's basic functions and what visualization tools are available. I'm thinking of doing additional studying starting with this lecture.
How to use Power BI Basics
Power BI Data Transformation
How to use Power BI visualization tools
Power BI leverages one of the largest and fastest-growing business intelligence clouds, and by combining Power BI security with Azure Private Link, Azure Virtual Network (coming soon), and service tags, you can better protect your organization's data. Furthermore, with low monthly per-user pricing, you can cost-effectively extend BI and analytics capabilities to all your users, building a data culture across your organization. If you're looking for a "good value" data analytics tool, why not start with Power BI?
What you'll learn in this course 📚
In this "Data Visualization with Power BI for Beginners" course, you'll learn the basics of Power BI. You'll import Excel data and use the query editor. You'll analyze and visualize your data using various graphs and charts. You'll also share links to visualization results, making it easy to share your data with others.
.gif?w=960)
Who is this course right for?
Non-majors or those new to data analysis
For those new to Power BI
Anyone who wants to learn data visualization
14,974
Learners
398
Reviews
17
Answers
4.7
Rating
7
Courses
This is the DIP Daegu Big Data Utilization Center.
Our staff, consisting of data analysts, are conducting the lectures. :)
If you visit the center, we provide data analysis and consulting support free of charge.
Homepage YouTube Channel
All
3 lectures ∙ (42min)
Course Materials:
All
77 reviews
4.6
77 reviews
Reviews 1
∙
Average Rating 5.0
Reviews 1
∙
Average Rating 5.0
Reviews 1
∙
Average Rating 5.0
Reviews 2
∙
Average Rating 5.0
Reviews 10
∙
Average Rating 5.0
Check out other courses by the instructor!
Explore other courses in the same field!
Free
![[For Beginners] Data Visualization with QGISCourse Thumbnail](https://cdn.inflearn.com/public/courses/327036/cover/22665c92-3392-4ea7-9bc5-b49a779b663d/QGIS_복사본-001.png?w=420)
![[For Beginners] Machine Learning with Kaggle • Deep Learning AnalysisCourse Thumbnail](https://cdn.inflearn.com/public/courses/327034/cover/303d9d8a-4e3e-4654-b9fd-4000b7628324/캐글 _복사본-001.png?w=420)
![[Mito] Python Data Analysis Starting with MitoCourse Thumbnail](https://cdn.inflearn.com/public/courses/327600/cover/86eb8935-b4ba-4c9b-a13d-c52b423219bd/327600-eng.png?w=420)
![[For Beginners] Machine Learning Analysis with AutoKerasCourse Thumbnail](https://cdn.inflearn.com/public/courses/327164/cover/2825a3d8-08a1-4baf-9a21-698f89e877e3/인프런 강의 이미지.png?w=420)
![Easy and fun [Data visualization] with over 80 examplesCourse Thumbnail](https://cdn.inflearn.com/wp-content/uploads/data-visual.png?w=420)
![[2024] Power BI Basic Course for Tired Excel Users (Beginner to Intermediate)Course Thumbnail](https://cdn.inflearn.com/public/courses/333721/cover/5ded8f1c-907b-493d-85ae-2fd641384417/333721.png?w=420)
![[Work Automation Using Free MS RPA] Power Automate Desktop EssentialsCourse Thumbnail](https://cdn.inflearn.com/public/courses/329655/cover/8364da63-535b-4613-9b02-3dcdfc21791d/329655-eng.png?w=420)
![[Work Automation Using Free MS RPA] Power Automate Desktop BasicCourse Thumbnail](https://cdn.inflearn.com/public/courses/329047/cover/35cb417d-cd84-47f8-a20f-653724b03a77/329047-eng.png?w=420)
![[Work Automation Using Free MS RPA] Power Automate Desktop - Excel AutomationCourse Thumbnail](https://cdn.inflearn.com/public/courses/330201/cover/8adc841c-39de-4770-98d3-2439ed8881a3/330201-eng.png?w=420)

![[Pass ITQ Excel A in One Go] in 3 daysCourse Thumbnail](https://cdn.inflearn.com/public/courses/329652/cover/b44e11b6-a47e-4993-86ea-a85da9836bb5/329652-eng.png?w=420)
![[D-PEC UP_PASS] National Technical Qualification: Management Information Visualization Ability (Written Exam)Course Thumbnail](https://cdn.inflearn.com/public/files/courses/336327/cover/01jytyqa2egrzn52a7m57fntzk?w=420)