Pandas for Data Analysis: From Basics to Data Analysis
Datarian's Pandas basic course with over 10,000 cumulative students and rich online/offline lecture experience. Learn Pandas, Python's representative data analysis library, systematically with official documentation. You can also improve your proficiency by learning theories and solving problems in parallel.
Teacher, you are really the best! Thank you so much... The reference materials you show us during class are so good that I didn't know there was something like this... I'm just gratefulㅠ I think it would be good if you release more Python lectures...!!!!
5.0
김태우
100% enrolled
It's really good!
5.0
kim_dh
98% enrolled
I'm listening to your lectures starting from SQL. Thank you for the helpful lectures. ♥
What you will gain after the course
Processing data with Pandas
Analysis and visualization using Pandas
Improve your Pandas proficiency by solving problems
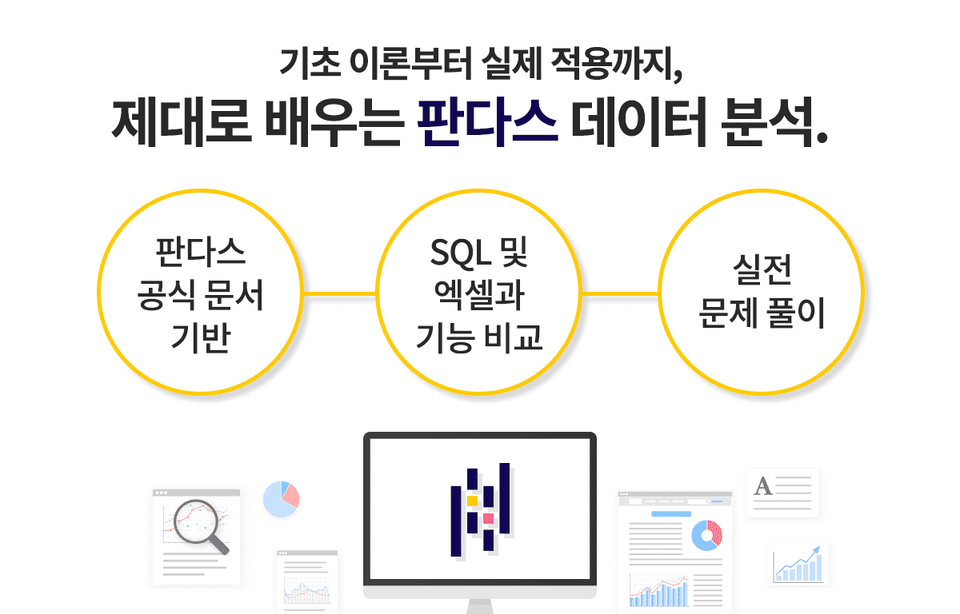
Pandas for data analysis, Get a solid understanding with the official documentation!
Pandas, why should I learn it?
Using the Python library, Pandas You can analyze data easily and conveniently.
When data analysts conduct analysis in Python, the first thing they typically do is import the Pandas library . Whether it's visualization, machine learning, or applying statistical models, preprocessing data to create a suitable format is essential. Pandas is the library (package) most specialized for this data handling process, and is therefore the most widely used.
Get started with Pandas, the essential Python data analysis course, with Datarian!
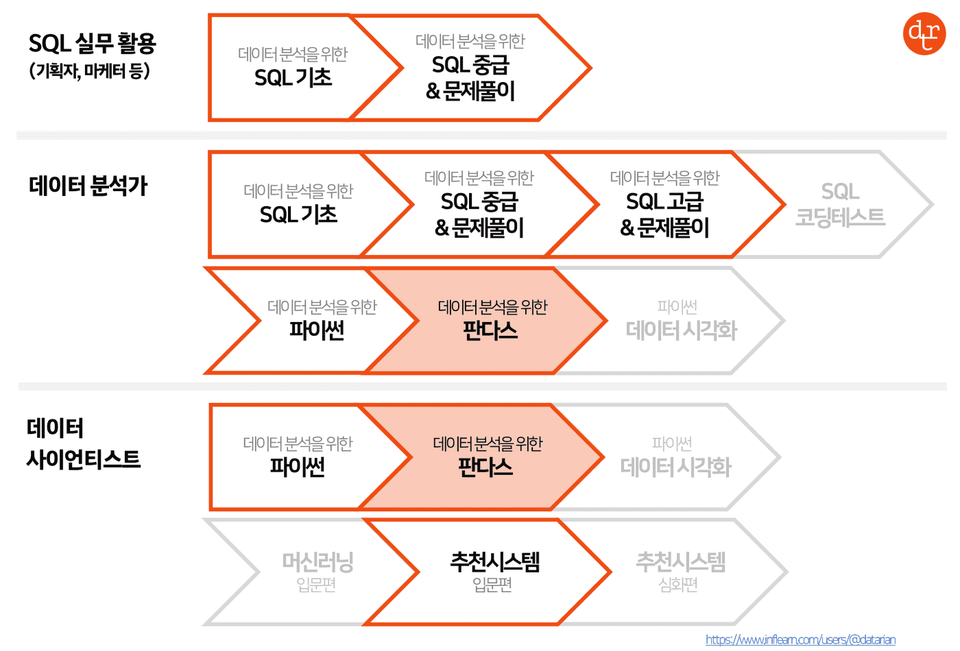
✔️Course Roadmap
What makes this course special?
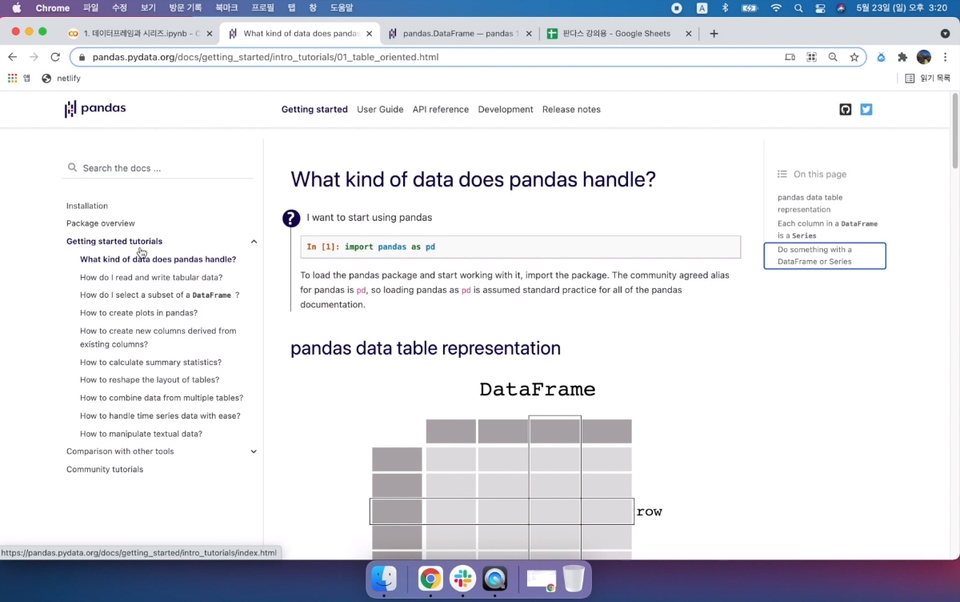
Use the official Pandas documentation.
We'd all agree that "Googling is essential" when coding. While the web offers a wealth of documentation for information, the official documentation is by far the best. It offers precise terminology and usage guidelines. Even those already proficient with Pandas are often surprised by the official documentation, exclaiming, "Wow, there's such a great feature!"
For those of you just starting out with Pandas, why not start with the official documentation, the best textbook ever? Our course will serve as a guide to help you on this journey. You'll learn by reading the official documentation, following along with example code, and adding additional explanations.
Comparisons with SQL and Excel help you understand quickly.
The data Pandas handles is a "two-dimensional data frame." While the term "two-dimensional data frame" might sound unfamiliar, it's actually a concept you're already familiar with. Think of it as tabular data, like those often seen in spreadsheets like Excel. If you're familiar with SQL tables, you'll understand it even better.
Because Pandas is a tool that handles similar data types, it often offers similar, or even more powerful, features than SQL and Excel. That's why, when learning a new function, I've included comparisons with SQL or Excel. Learning by comparing it to what you already know will make it easier and faster to understand, right?
This course is helpful for those who are starting Python to do more in-depth analysis and visualization than what can be done with SQL, or for those who need Pandas to handle large amounts of data that cannot be imported into Excel, or for those who are already using other tools.
Q. SQL, is it something I absolutely need to know?
I recommend starting with SQL first, but if you have experience with Excel, I don't think you'll have much difficulty understanding the lecture :)
Excel, Pandas, and SQL are all similar tools in that they handle tabular data with rows and columns . Their supported features are also very similar. The official documentation, which is also included in the lecture, requires no prior knowledge of any language other than Python. While some concepts common to SQL when working with data tables, such as joining two tables using common keys and group-by operations, are omitted from the video, supplementary material is provided at the bottom of the video. If you've watched the sample lecture and thought, "This is worth a try," that's enough.
Improve your skills by solving problems together.
Seeing is believing! Learning is only as effective as practicing. Take the time to truly understand and master the grammar you've learned, understanding the specific situations and tasks for which it's applicable.
At the end of each section, we'll provide a list of problems that allow you to practice the functions you've learned in that section. We encourage you to pause the lecture and review by solving the problems. We'll also share the solution process in the final video, "Problem Solving," of each section. The final section consists of problems that synthesize everything you've learned so far, so let's keep going!
Recommended students
Pandas Systematically Anyone who wants to understand
With problem solving Pandas Those who want to study
When using SQL Analysis area with Python Those who want to expand
Spreadsheets such as Excel I tried it Anyone who wants to learn Pandas
The curriculum Please check it out.
Pandas Warm Up!
We'll learn about Google Colaboratory (Colab), the platform we'll use in this course, and then work through the official Pandas documentation. We'll explore the steps involved in loading and saving data with Pandas, and learn how to select specific columns and rows.
Data Exploration A to Z.
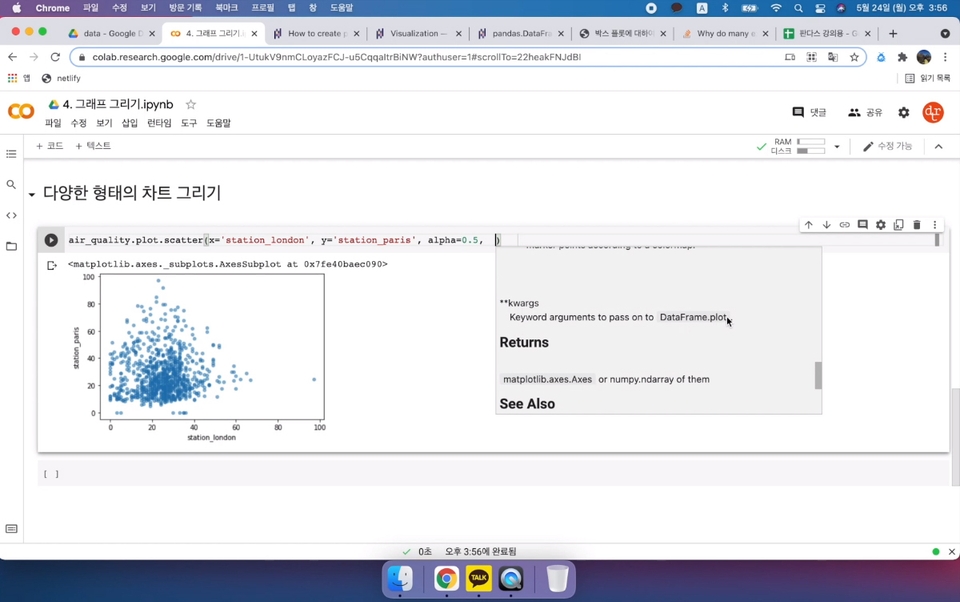
We'll use Pandas to create simple visualizations to understand data trends and flows. You'll also learn how to create new columns by calculating values from existing columns, perform necessary calculations, and aggregate and scale data.
Data organized into tables!
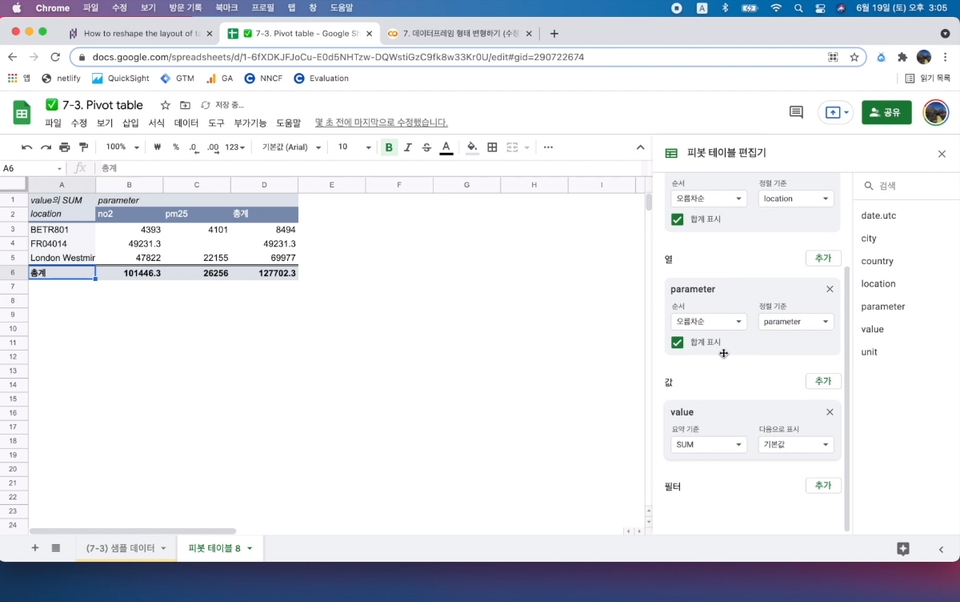
Learn how to transform and sort tables, link with Google Spreadsheets, and create pivot tables for data. You'll also learn how to link rows from multiple tables and combine them using common columns.
Various types of data are also OK.
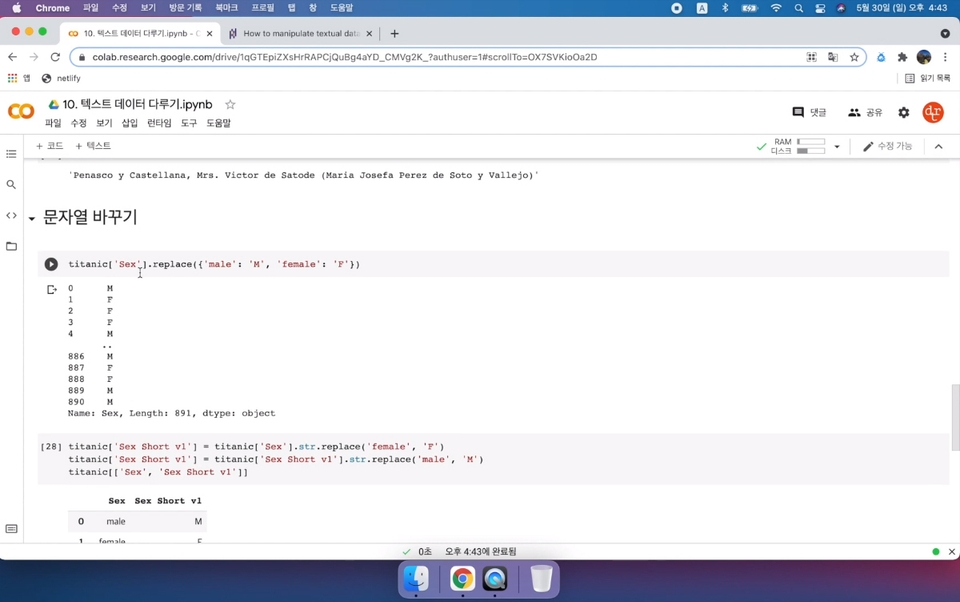
We'll learn how to handle time series data and textual data, and even how to use regular expressions to find specific patterns.
Teacher, you are really the best! Thank you so much... The reference materials you show us during class are so good that I didn't know there was something like this... I'm just gratefulㅠ I think it would be good if you release more Python lectures...!!!!
Sangyeol, who left this course review, is the best. Thank you so much... I'm so happy that you found the reference materials useful. I'm working hard on creating a Python visualization lecture. I'll visit you within the first half of this year! And I've collected the materials that I often recommend to those studying data analysis so that you can see them on KakaoTalk. You can see them even if you don't follow me, so I hope you find the materials useful to Sangyeol. Thank you~ :D http://pf.kakao.com/_DQxfsb (Open the link on your mobile phone and go to the board tab!)
Hello! This ID seems familiar to me. Did you enjoy the lecture? The SQL lecture and Python lecture have slightly different feelings, so I wonder how you listened to them. Thank you for your review!


![[A hundred words are not as good as seeing once] Basic SQL for data analysisCourse Thumbnail](https://cdn.inflearn.com/public/courses/324566/cover/aa1fac55-6e80-4506-9c92-f32c2b65f93a/sql_basic.png?w=420)
![[Practice Makes Perfect] Intermediate SQL for Data AnalysisCourse Thumbnail](https://cdn.inflearn.com/public/courses/324568/cover/9f81ac3f-d663-49e7-9eda-61253189790c/sql_intermediate.png?w=420)
![Data-Driven Design Without a Data Analyst [Datarian Seminar Replay | November 2025]Course Thumbnail](https://cdn.inflearn.com/public/files/courses/339608/cover/01kbpcbn9gv7ysm630hkz313gd?w=420)
![Free GA4 Course for Beginners [Datarian Seminar Replay | July 2025]Course Thumbnail](https://cdn.inflearn.com/public/files/courses/338668/cover/01k38fk7pq2a3ht1pn7nwrk7s4?w=420)
![Data Analysis Portfolio That Takes You Straight to an Interview [Datarian Seminar Replay | January 2025]Course Thumbnail](https://cdn.inflearn.com/public/courses/336048/cover/c90f7e08-0953-41b6-9892-236f20b110ec/336048.png?w=420)
![Effectively Persuading Marketing Plans Based on Data [Datalian Seminar Replay | October 2024]Course Thumbnail](https://cdn.inflearn.com/public/courses/335163/cover/af19c098-8652-462d-8533-939a23e1d5bd/335163.png?w=420)
![Data Analyst, Which Company Should I Go to? [Datarian Seminar Replay | July 2024]Course Thumbnail](https://cdn.inflearn.com/public/courses/334459/cover/22684393-748c-43e3-8282-fcd6fee701d9/334459.png?w=420)
![Data Analyst Career with Generative AI [Datalian Seminar Replay | May 2024]Course Thumbnail](https://cdn.inflearn.com/public/courses/333839/cover/8abc6cdd-25bd-4a69-9527-16b9fc9cb460/333839.png?w=420)
![How are other companies doing funnel analysis? [Datalian Seminar Replay | March 2024]Course Thumbnail](https://cdn.inflearn.com/public/courses/333329/cover/9e7725db-639d-469a-adac-5089658875a6/333329.png?w=420)
![How did a non-major become a data analyst? [Datalian Seminar Replay | January 2024]Course Thumbnail](https://cdn.inflearn.com/public/courses/332976/cover/1c20f1ed-fb65-4c32-9624-4cedc370ed5b/332976.png?w=420)
![Senior Data Analyst's SQL Coding Test Know-how Revealed [Monthly Datalian Seminar Replay | December 2023]Course Thumbnail](https://cdn.inflearn.com/public/courses/332774/cover/a9900f25-50a4-46f1-930d-e6ef03ea88f1/332774.png?w=420)
![Everything About Marketing Performance Analysis (feat. GA4) [Monthly Datarian Seminar Replay | November 2023]Course Thumbnail](https://cdn.inflearn.com/public/courses/332465/cover/fc2a010b-e04d-48ee-b842-f3698bc66634/332465-eng.png?w=420)
![Beyond SNS Marketing to Offline Advertising with Data [Monthly Datarian Seminar Replay | October 2023]Course Thumbnail](https://cdn.inflearn.com/public/courses/332241/cover/5d548964-3f42-4b6b-9e46-67cf2e1f670f/332241-eng.png?w=420)
![Complete Guide to Data Analyst Job Preparation by Industry Professionals [Monthly Datarian Seminar Replay | September 2023]Course Thumbnail](https://cdn.inflearn.com/public/courses/331936/cover/9c693d54-1183-4dcf-bda8-a46e161c61d2/331936-eng.png?w=420)
![These days, hot side projects and ways to view data [Monthly Datarian Seminar Replay | August 2023]Course Thumbnail](https://cdn.inflearn.com/public/courses/331782/cover/4683da6b-272f-4901-a0d9-a744f00289e9/331782-eng.png?w=420)
![Data Analyst Ask Me Anything [Monthly Datarian Seminar Replay | July 2023]Course Thumbnail](https://cdn.inflearn.com/public/courses/331572/cover/251a81dd-6e3f-414f-9b3c-862567366618/331572-eng.png?w=420)
![GA4 Utilization Methods You Can Use Right Away Tomorrow [Monthly Datarian Seminar Replay | June 2023]Course Thumbnail](https://cdn.inflearn.com/public/courses/331370/cover/e1ecc7a1-6c05-4951-857a-aa6a72eee87a/331370-eng.png?w=420)
![Data-Driven Content Marketing That Drives Business Growth [Monthly Datarian Seminar Replay | May 2023]Course Thumbnail](https://cdn.inflearn.com/public/courses/331081/cover/b10ce0eb-8a35-4653-a3f5-488a06981d60/331081-eng.png?w=420)
![[Renewed] Python Machine Learning Bootcamp for Beginners (Easy! Learn by Solving Real Kaggle Problems) [Data Analysis/Science Part2]Course Thumbnail](https://cdn.inflearn.com/public/courses/327464/cover/55c4db7b-7764-43cc-ac75-d9e8d08098f1/327464-eng.png?w=420)
![[Side Project After Work] Big Data Analysis Certification Practical Exam (Type 1, 2, 3)Course Thumbnail](https://cdn.inflearn.com/public/courses/329972/cover/dcfb28fd-48c1-4bb1-ab31-d59eac874194/329972-original.png?w=420)