Data-driven stock quant investment with Python Part 1
In this class, you will learn about the principles and methods of analyzing and processing various types of financial data using Python's Pandas library, apply them to situations you may encounter in the real world, and ultimately learn how to implement backtesting based on financial statement data (based on Kang Hwan-guk's book, "You Can Do Quant Investment"). As a result, you can break away from being a "passive investor" who simply follows what others say without verifying or basing the investment logic, and become a "self-directed and active investor" who can freely extract various elements necessary for strategy implementation from data and quantitatively analyze them using Python and Pandas.
This course is related to monetization/side business. Results may vary by individual, so please consider your purchase carefully.
Reviews from Early Learners
4.8
5.0
Cho
93% enrolled
This is the level of self-study of data analysis using Python for a year 3 years ago. (Beginner~Beginner level)
I came across this lecture when I was about to start studying again for stock analysis after giving up on it for a living.
I've only listened to half of it, but the more I listen, the more I think about how great it would have been if I had known about this lecture 3 years ago, so I'm leaving a review in advance. Come to think of it, this lecture wasn't available 3 years ago. ㅠ
It was the best to listen to it now.
It's a great lecture that makes you feel the need to study formally while listening to the basics and various tips necessary for analysis, and even the concept of unit testing in data analysis. I regret that my expressive skills are lacking. It's a life lecture.
Lastly, if you have time, please make a lecture on financial information crawling, automatic trading system, and reinforcement learning utilization into a lecture.
Stay healthy in the cold winter~ Be happy. Thank you.
5.0
임현택
84% enrolled
This is the best lecture. It explains so clearly, so simply, so intuitively, so easy to understand. I don't leave reviews carelessly.
5.0
ㅇㅅㅇ
100% enrolled
I wanted to finish the course and leave a review, but since there are no reviews yet, I think there might be some people who are hesitating whether to take this course or not, so I'll write a few words about the course review.
My thoughts are:
1) I came to learn quant, but I'm learning Pandas properly again.
What code is efficient, why is it fast, etc.
For those who just want to learn Pandas without a topic, it's a very good choice to take this course in the first place, thinking that they're learning quant as a bonus.
2) The lecture style is not at all vague or hesitant. It explains very clearly, and I really like the tone of voice and speed. There's no need to speed it up 1.5x.
3) The lecture content is very informative. As you listen, you can feel that it's very systematic, and that they put a lot of sincerity into the production of the lecture.
Conclusion) I'm not interested in stocks, but if you think like this, I think this is a course you can miss. Quant is a bonus, and I think this is a lecture where you can learn Pandas properly. I didn't finish it, but I took 70% of the class and I'm writing down what I felt. I'm looking forward to future lectures on topics like automatic trading or Tensorflow. I think I'll take all of the instructor's lectures.^^
What you will gain after the course
1. How to use and basic operating principles of Python's Pandas library developed for financial data analysis/processing
2. How to analyze various forms of financial data and how to transform the data into a form for testing strategies.
3. Examples of financial data that can be encountered in real life and techniques that are absolutely necessary for implementing backtesting.
4. Principles of visualizing data in Python and how to understand data more intuitively through this
5. Principles of vectorized backtesting implemented with Pandas and things to watch out for when backtesting
6. Real-life project: Implementing Kang Hwan-guk’s ‘You can do it! Quant investment’ strategy
Invest in stocks smartly & strategically! Take on the challenge of data-driven investing with Python!
Most of you interested in this course likely have some experience with stock investing. While some may have made significant profits, most have likely experienced significant losses or been caught up in a series of stocks, often against their will. While everyone's investment preferences and environments may vary, the reasons for investment failures may seem diverse. However, the reasons often appear to be somewhat consistent. This is especially true for beginners, often referred to as "ju-rin-i." What do you think are the reasons?
Humans are inherently vulnerable to investing. Even if we make a firm decision with unwavering determination, even the slightest change in our knowledge or surroundings can cause us to become psychologically unstable. We tend to only accept information that favors our thinking and judgment, or we tend to hypnotize ourselves into believing that our judgment is infallible. This happens instinctively, regardless of our will .This may be due to an unwillingness to experience the sense of defeat that comes from admitting loss, but more importantly, it's likely due to a lack of clear investment criteria or alternative options . So, how do those who invest based on such instincts fare in the stock market? Below are excerpts from reactions in stock market forums and KakaoTalk groups during past market downturns:
1. Mental breakdown
“Do you all have your mental strength left?”
“I can’t focus on work because of the stocks at work 😭... Why is it falling like this...”
“Why is it that only the things I buy go down in price? 😭 Everything I sell goes up the next day...”
2. Unclear buying point
“I ended up with about 10 million won today... I think it’s time to start saving up little by little...”
“Seeing everyone organizing, I think I can buy a little bit at a time...”
"Is there anyone who entered the market hoping for a rebound tomorrow when the price breaks below 2100?"
"I had some fun with inverse trading, but now it seems like it's bottoming out, so I went with leverage and lost money... I'm not even going to look at it for a while. I don't know if it'll work out, but..."
3. Impulsive cut-off timing (by psychological pressure and crowd psychology)
“It’s a small return, but I’m getting out of it with the consolation that I avoided losses while the index was being destroyed 😭”
“I was supposed to go in today, but my mental state was broken, so I thought this was it, so I gave up 😭😭”
"I held back tears and cut my 20% loss. I'll come back to buy in five years..."
“I was going to hold on to it, but I couldn’t hold on any longer and ended up requesting a refund today😆😆 I only invested in index funds, but I lost about 20%...”
"I just closed half of my position... I'm cutting my loss by 5%. I'm still hesitating about what to do with the remaining half."
4. Forced Johnver
"With a 40% loss, I'm psychologically over the cut-off line and just waiting to see. It'll go up someday... Whew..."
5. Panic (feat. My Fortune)
“I thought I should cut my losses when the rate was minus 7%, but I couldn’t cut my losses because it seemed like it would be the lowest point at the time. When it hit minus 10%, I thought it was time to cut my losses, but other stocks were falling so quickly that I had no choice but to let go and watch. When it hit minus 15%, I thought it was the real bottom, so I took a risk. I can't cut my losses because I feel bad about the stocks I thought were blue chips now that they're down over 25%. Even if it falls further, I guess I have no choice but to live with it as my destiny.”
How was it? It probably sounds like someone else's story. Investment methods without clear standards or foundations, like the one mentioned above, will only lead to greater confusion and even greater losses when similar situations arise in the future. Regardless of the reason, persistent losses will only make us increasingly anxious, and in extreme cases, it can feel like the market is always moving against our expectations. Because humans are still more influenced by emotions than reason, we're likely to repeat the same mistakes, ultimately leading to the loss of all our hard-earned money. Many of you are probably worried about this vicious cycle and wondering how to proceed with your investments going forward.
Does that mean we really study investing? I don't think so. It's quite ironic. The passion and attitude we used to diligently study day and night to prepare for college entrance exams and land a job at our desired company vanish in the face of the stock market, replaced by speculative trading fueled by greed and desire . Without a thorough understanding of the market or stocks, we simply stare at charts that have no chance of rising, constantly agonizing over which stocks are good and when to enter. In a way, this is a place where we need to prepare for challenges far beyond our own, taking a much longer-term approach and adopting a slightly different approach to survive.
If you have experienced or are still experiencing the instinctive(?) investment as mentioned above and do not have any special plan in mind, how about trying data-based stock investmentwith Python together? Through this class, we will learn about “computers (programming)” that are more cool-headed, mechanical, and smarter than humans.With this in mind, I'll be using your skills to develop data-driven, systematic, and evidence-based investment habits . For those who struggle day after day, investing their hard-earned money without thorough preparation or a trusted advisor, or for those who have tried everything but struggle because Excel is the only tool they know how to use, this course will use the Python programming language to help you break free from bad investment habits and build a foundation for smart investing .
How satisfied are you with your current investment approach? Are you investing based on emotions and without clear, objective criteria?
🙌 Why should you learn “data-driven stock investing” in Python?
As we enter 2020, more than 44 zettabytes of data are generated globally every day. Consequently, the value of data is increasing, and decision-making processes based on it are becoming increasingly important. Programming skills to extract insights from massive amounts of data and perform modeling are becoming a fundamental requirement.
In this day and age , is Excel still a powerful data analysis tool? Not only is Excel complex and cumbersome for processing and automating data exceeding hundreds or thousands of megabytes, but compared to programming languages, it requires a relatively large amount of time and effort to produce the same output. Furthermore, it's extremely difficult to record and organize the analysis process leading to specific results.
However, with the Python programming language , a variety of analyses and diagrams are possible with just a few lines of code. Python's rich library of data analysis tools allows for easy processing and analysis of any type or volume of data, providing an interface that easily organizes and presents the problem-solving process. Furthermore, it can be easily extended to create a single, end-to-end program (or application). Due to this appeal, even the banking and finance industries, known for their extreme conservativeness, have long since begun to use Python to replace Excel.
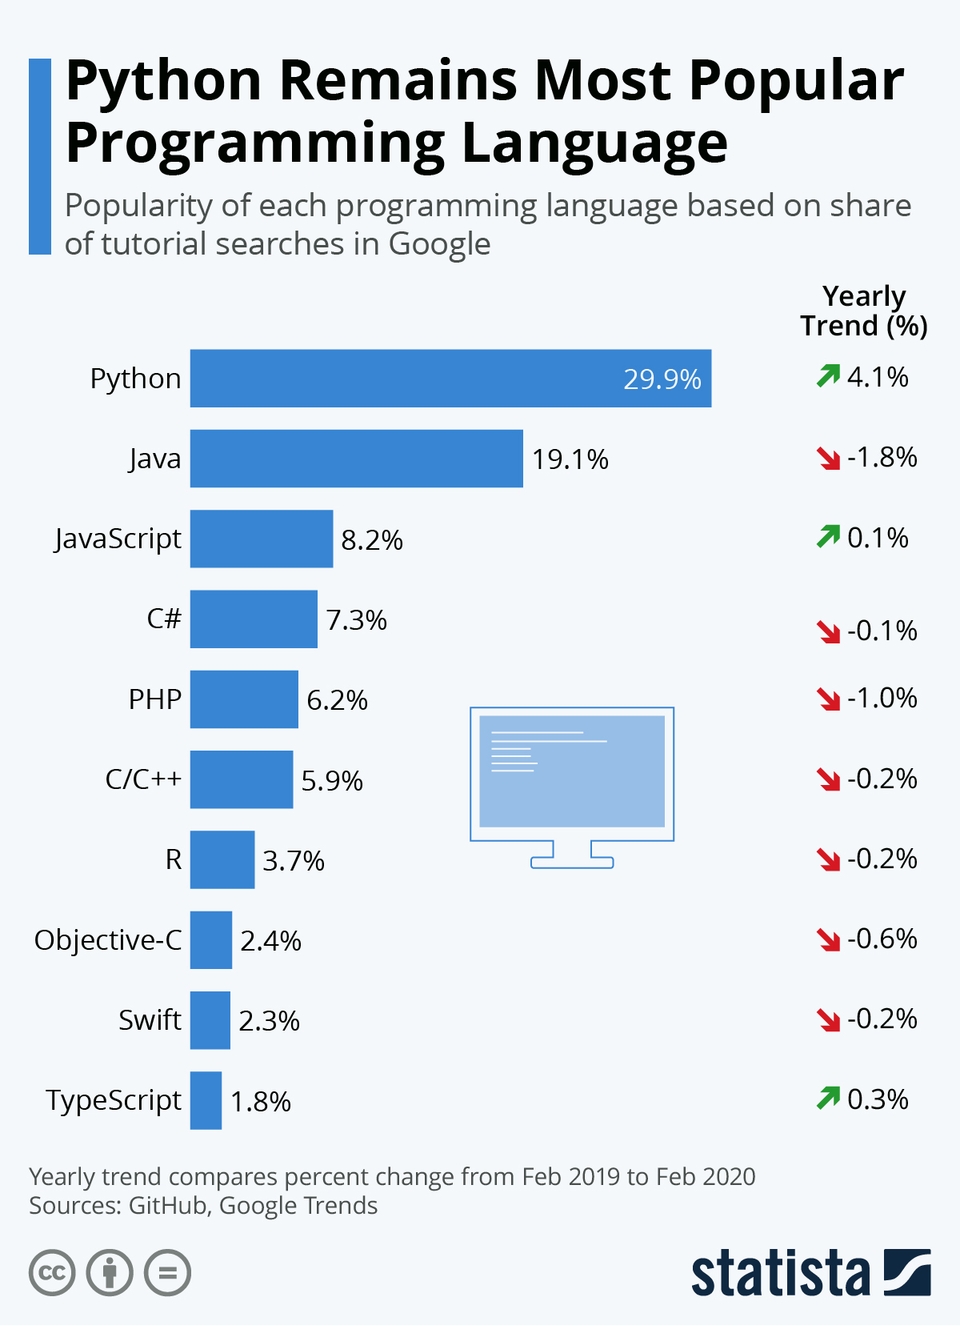
Python's popularity continues to grow. Its rise to the top of the programming language rankings, surpassing other languages, is largely attributed to the library Pandas . Pandas is a Python library that facilitates any analysis of two-dimensional structured data . Originally designed to facilitate the handling of financial data, it is optimized for financial data analysis more than any other existing tool. I myself use Pandas primarily for analyzing structured data in various fields, and I actively use it in my finance and stock trading projects, where the majority of my code is written in Pandas, reaping the benefits. Recently, Pandas-based libraries that support distributed processing across various computing environments and further enhance operational performance have been emerging, further solidifying Python's position as the definitive data analysis tool.
In this course, you'll learn how to utilize the Pandas library to analyze and process various types of real-world financial data, from extracting investment targets from annual financial statement data, backtesting them, and graphically displaying the results . We'll also explore precautions and ways to improve upon these strategies for more realistic backtesting. This course will provide a valuable opportunity to develop "data-driven investment strategies"for investors who, without the experience to personally verify their strategies, invest in stocks favored by others or simply rely on intuition, as well as those who seek a more quantitative and systematic analysis of corporate value. Furthermore, for those who have memorized Excel functions and macros but struggle to understand how to handle new data, this course will offer a chance to experience the new world of Pandas.
In an era where coding and programming skills are essential, Pandas can be an excellent choice for quickly and effectively analyzing and utilizing the overflowing data. Furthermore, gaining experience in data analysis using Pandas can serve as a great starting point for becoming more familiar with the unfamiliar world of Python. Python's popularity, vibrant community, low learning barrier, diverse libraries, and, most importantly, Pandas, optimized for financial data analysis and processing—all of these are already ready and waiting for you. With these tools, you'll be able to perform a variety of analyses on any financial data, and even backtest your desired investment strategies with complete freedom. All you need to do is prepare yourself to embrace it. This course will be a valuable asset far more valuable than two Samsung Electronics shares ( ≈ ₩100,000) . Why not start now?
Stock investors will be divided into two groups going forward. Those who know Python vs. those who don't.
🙌 What are the benefits of backtesting and investing in stocks based on your own data?
Since you will have your own trading rules based on data , you will not need to look at the market, charts, or stock bulletin boards as often.
Even in rapidly changing market situations like financial crises , you will never be psychologically shaken.
Sufficient backtesting on past data will allow you to make more informed investments .
You will be able to make decisions based on the most important factors you have identified through data verification , without being swayed by the news or public opinion.
You will be able to create a program that is most optimized for you , tailored to your tastes.
You can backtest tens or even millions of trades while you sleep, commute, or vacation, and even automate your actual trading.
When you use Python for data-driven investing, It can protect not only your mental health but also your valuable assets.
🙌 What can you do with Python + Pandas?
After completing this course, you will be armed with the formidable weapon of Pandas. By mastering Pandas, you will gain the fundamentals to extract and backtest various investment indicators from financial data (financial statements, daily/minute charts, individual/institutional/foreigner supply/demand, dollar/oil indices, programmatic trading trends, etc.). Furthermore, you will become an expert in analyzing not only financial data but also a variety of structured data.
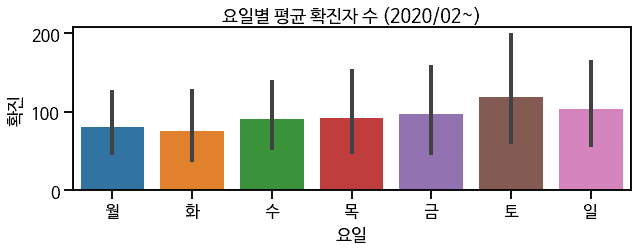
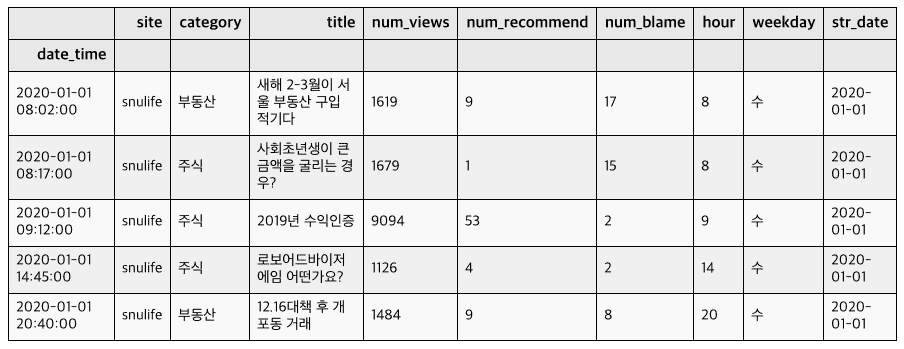
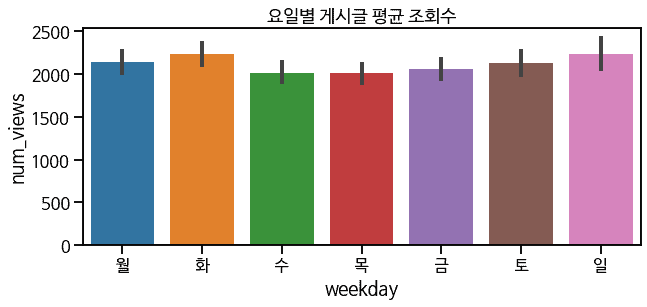
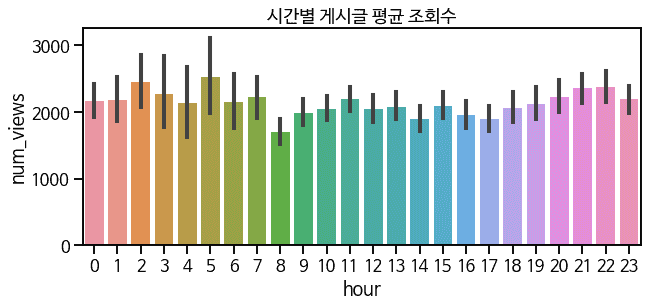
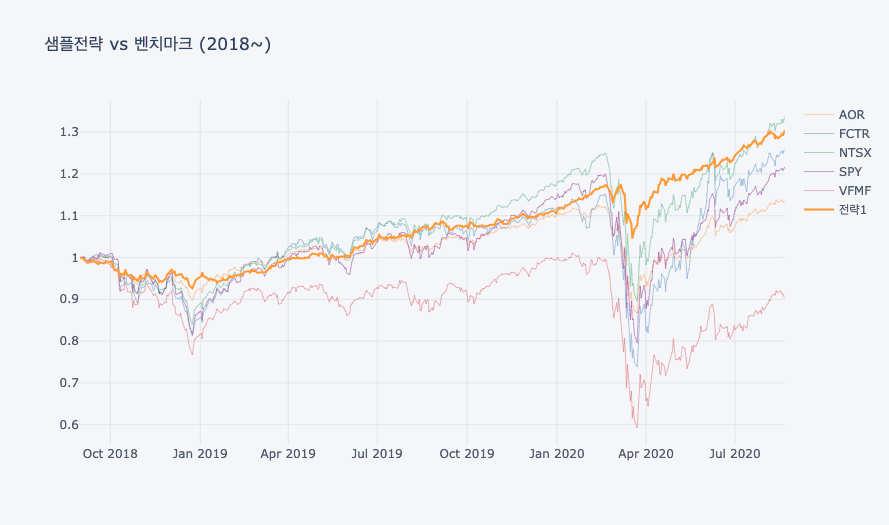
Below is a simple toy projectI implemented using only Pandas, using data I collected individually .
Analysis of confirmed COVID-19 cases by day of the week
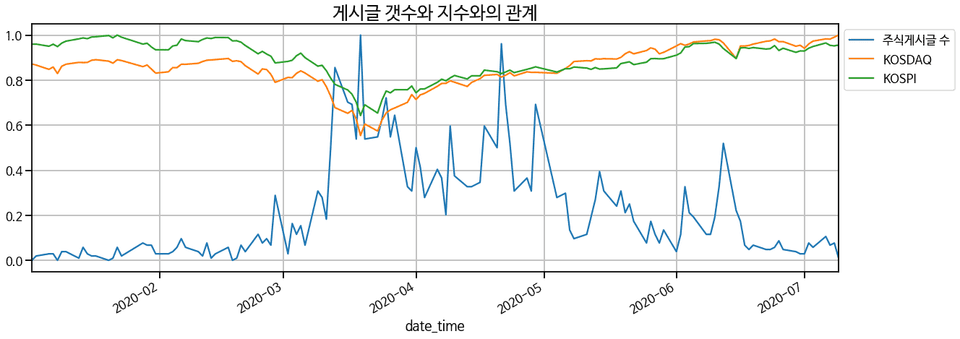
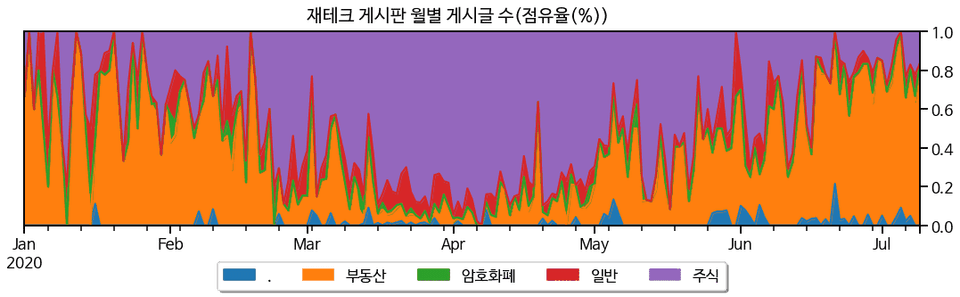
Analysis of stock community bulletin boards (checking changes in the number of posts when stock or real estate-related events occur)
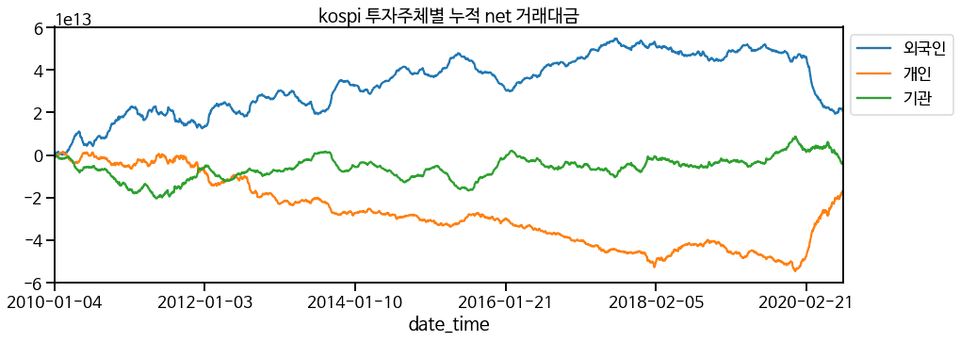
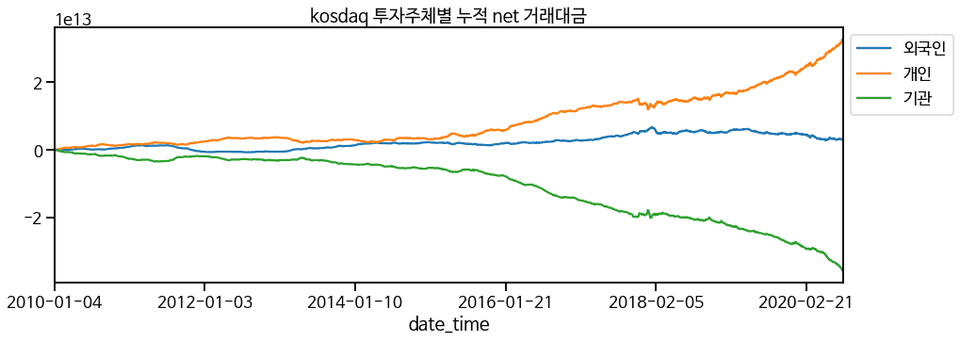
Analysis of cumulative net trading volume by investor in the KOSPI/KOSDAQ market
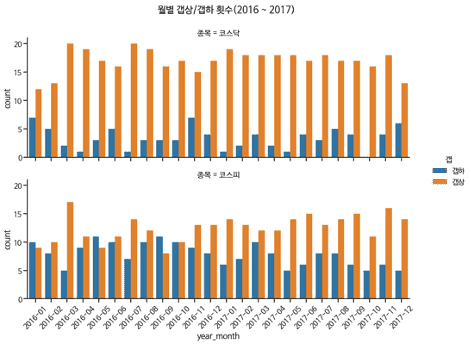
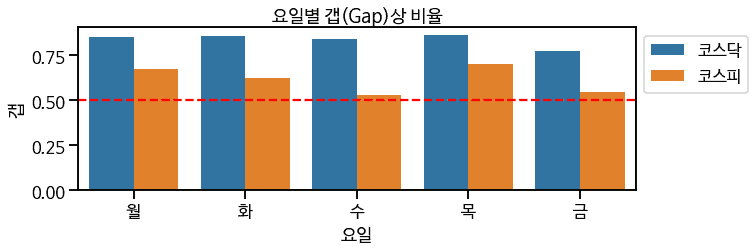
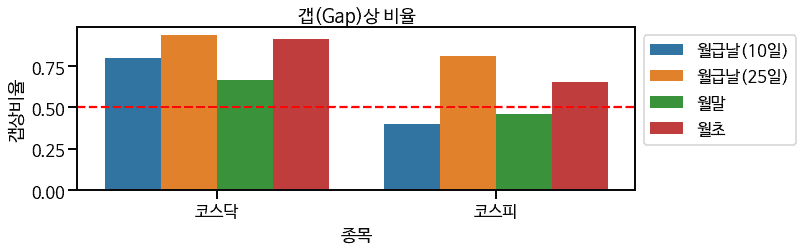
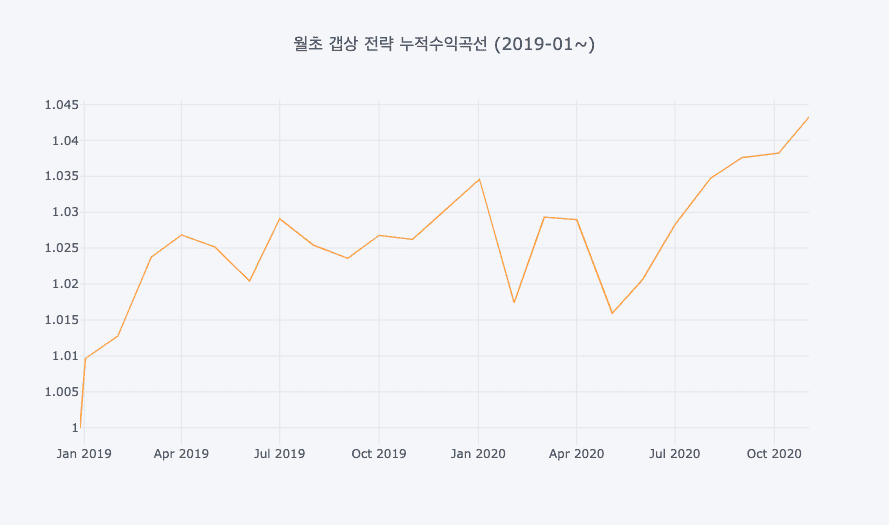
Create a simple strategy based on the daily gap-up/gap-down ratio (opening price compared to the previous day's closing price).
Data-Driven Strategies vs. Benchmark Backtesting Performance Comparison
Most importantly(?) - You will be able to take the upcoming course "Data-Driven Stock Investment with Python Part 2" without any prerequisites.
If you know how to handle Pandas, Your perspective on the world changes.
🙋 Top 6 Questions Students Ask the Most
Q. What are the differences between this online course and previous offline courses? Q. Can you also share strategies for making money in your lectures? Q. Are high-frequency trading strategies like scalping and short-term swing trading included in the course content? Q. To become a quant, do I need to know everything about mathematics/probability/statistics, including concepts like risk, alpha, beta, and factor models? Q. Just because past investment data has proven its performance doesn't mean it will perform well in the future, right?
A. The answers to the above questions are covered in detail in ' 6. FAQ ' of ' Section 0. Orientation '.
Q1.Is any prior knowledge required? I've only read a Python grammar book once. Will I be able to follow along? Do I also need to know about stock financial statements?
A1. This course is for those who have some familiarity with programming concepts and the basics of Python . If you are new to Python, I recommend taking my introductory course, ' Anyone Can Learn Python (Click to go) ' (If you are just starting out with Python, why not take this course quickly to review?) Also, since you will be analyzing financial statement data and creating strategies based on it, it is helpful to have knowledge of indicators frequently used in investment (PER, PBR, etc.) (but it is not required ).
Q2.Is the main focus of this course trading or data analysis?
A2. If I had to be specific, I'd say this course focused more on "financial data processing and analysis." While developing my own investment system, the area I spent the most time and effort on was, "How can I quickly and easily processfinancial data, which represents the same information but has various forms,to fit my desired strategy ?" Initially, I didn't prioritize this aspect. My top priority was quickly implementing programs and strategies that would allow me to buy and sell at any given time. Therefore, I built the system using my limited programming knowledge. Consequently, implementing new strategies often required extensive revisions to the existing code. I kept encountering obstacles along the way, and after much googling, I finally concluded that " data preprocessing" and " removing potential discrepancies in real-world applications (e.g., processing past data to avoid looking into the future) were the most important. I believed that if I could solve this problem, many other aspects could be implemented with less effort. Ultimately, I adopted Pandas to create a realistic and robust investment system. You can think of the content of this class as a curriculum that has been compiled from the experiences I have had during this process .
Q3. Do you actually make data-driven investments?
A3. I'm actually implementing the strategies I developed based on the content covered in this course , and I'm personally seeing satisfactory results. The course content focuses on the elements I found most challenging and the tools I found most useful in developing my investment system. Therefore,every single piece of information and technique covered in this course is applied seamlessly within my investment system.Therefore, I believe the course content is highly credible, and with just a little bit of practical application, I'm confident you'll gain the fundamentals and skills to freely create your own investment strategy.
Q4. There's a lot to build if you want to create an investment system.I'm still a Python beginner,so it'll probably take at least a year to build it. Isn't that too late?
A4. Anyone who tries to do everything at once will feel overwhelmed and frustrated. I've been working on this for over two years now, and I haven't even completed half of the system I ultimately want to build. I'm still steadily adding, testing, and verifying new features. If you were planning to invest for a year or two and then leave the stock market, I wouldn't have anything to say. However, for the average retail investor, who plans to invest for the rest of their lives, the mindset of "I need to quickly complete all the groundbreaking tools I'll use for the next few decades" is similar to the mindset of "I need to hit the jackpot with stocks and make a fortune quickly." From this perspective, the most important thing is to program each essential part of your current investment process, step by step. For example, if your strategy involves trading only one or two stocks, with ample time between buys and sells based on conditions and infrequent cycles, there's no need to build a system that automatically buys and sells through a brokerage API first. This will most likely work well with the ordering function of HTS or MTS, or even by manually placing a buy/sell order. The important thing ishow the (financial) data is (pre)processedduring this process .There is a huge difference in productivity, and Pandas will greatly help you speed up your work and improve the quality of your work.
Q5. If this is Part 1 of the course, is there also a Part 2 class? What does Part 2 cover?
A5. Part 1 covers the basics of Pandas, applying it to various financial data, focusing on financial statement data , and even learning how to perform simple backtesting using it. Since this lecture (Part 1) is the first lecture, it may feel a bit introductory. Part 2 will cover Pandas techniques that focus on time-series price data (OHLCV) data , and based on this, we will cover static and dynamic asset allocation strategies that require adjusting weights at various periods (monthly rebalancing, 60:40, all-weather, VAA, DAA, etc.) . In addition, we will delve into how to utilize various types of return data (e.g., log return) and implement evaluation indicators related to backtesting (e.g., annualized return, Sharpe, MDD, CAGR, Std) .
Q6. After attending the lecture, I feel like I'm getting better at handling financial data. But obtaining financial data is also a lot of work. 😭 What should I do?
A6. As mentioned in the orientation, data collection and processing is the most difficult and time-consuming task. We also offer a class that teaches you how to freely retrieve and automate the data you need from various sources: Python Web Crawling & Automation to Replace Your Work (click here).
🙌 Things to note before taking the class
The data provided in this lecture is sample data intended to demonstrate the application of what you've learned. Therefore, it may not be immediately applicable to real-world situations.
Responsibility for your investments always lies with the investor.
📚We've prepared this orientation video with as much care as the course content itself. While it's a bit long, it covers the direction and purpose of not only this course but also future courses, and covers topics you might be curious about. Let this orientation spark your desire to learn!
📚No more one-man lectures where the instructor stands in front of students! Classes where everyone understands the principles and works together! Shall we get started now?
Until the day when everyone in the country invests in Python!
Recommended for these people
Who is this course right for?
Anyone who wants to freely analyze various structured data as well as financial data using Pandas
Anyone who wants to learn not only the basic functions of Pandas but also the hidden powerful functions along with the principles
Anyone who wants to experience a single system flow from financial data preprocessing to backtesting
Anyone who is curious about how to implement backtesting based on financial statements, and the limitations and directions for improvement of this method
Anyone who wants to start investing in stocks more intelligently based on programming/data to suit the times
Anyone who feels the limitations of existing backtesting platforms or services and feels the need to create a program just for their own taste
When investing in stocks, people who are mentally exhausted every time due to investment methods such as intuitive trading, brain trading, and manual trading
Those who want to make investments that they can directly lead and judge objectively, rather than investing based on external information (funds, reports, reading rooms, stock recommendations, stock bulletin boards, etc.)
Those who want a class where students can apply the learning content on their own by understanding the principles, rather than a class where they simply run the code given by the instructor
Need to know before starting?
'Python that anyone can learn, whether they are a liberal arts student or a non-major' or Python basics, conceptual understanding of 'libraries' is required.
See roadmap: https://www.inflearn.com/roadmaps/474
This is the level of self-study of data analysis using Python for a year 3 years ago. (Beginner~Beginner level)
I came across this lecture when I was about to start studying again for stock analysis after giving up on it for a living.
I've only listened to half of it, but the more I listen, the more I think about how great it would have been if I had known about this lecture 3 years ago, so I'm leaving a review in advance. Come to think of it, this lecture wasn't available 3 years ago. ㅠ
It was the best to listen to it now.
It's a great lecture that makes you feel the need to study formally while listening to the basics and various tips necessary for analysis, and even the concept of unit testing in data analysis. I regret that my expressive skills are lacking. It's a life lecture.
Lastly, if you have time, please make a lecture on financial information crawling, automatic trading system, and reinforcement learning utilization into a lecture.
Stay healthy in the cold winter~ Be happy. Thank you.
I don't know what to do with myself since you said it's a life lecture. There are more contents that can be called a life lecture than this lecture, so I will definitely live up to your expectations. Thank you.
I wanted to finish the course and leave a review, but since there are no reviews yet, I think there might be some people who are hesitating whether to take this course or not, so I'll write a few words about the course review.
My thoughts are:
1) I came to learn quant, but I'm learning Pandas properly again.
What code is efficient, why is it fast, etc.
For those who just want to learn Pandas without a topic, it's a very good choice to take this course in the first place, thinking that they're learning quant as a bonus.
2) The lecture style is not at all vague or hesitant. It explains very clearly, and I really like the tone of voice and speed. There's no need to speed it up 1.5x.
3) The lecture content is very informative. As you listen, you can feel that it's very systematic, and that they put a lot of sincerity into the production of the lecture.
Conclusion) I'm not interested in stocks, but if you think like this, I think this is a course you can miss. Quant is a bonus, and I think this is a lecture where you can learn Pandas properly. I didn't finish it, but I took 70% of the class and I'm writing down what I felt. I'm looking forward to future lectures on topics like automatic trading or Tensorflow. I think I'll take all of the instructor's lectures.^^
I got goosebumps reading the course reviews... You seem to have accurately figured out the things I was thinking about while making the lecture, as well as the intentions and goals of the class. Haha. Just with the content of this course, I can do a lot of things in the future, but I think it will have even more synergy if I add it to the content of the lectures I will make in the future! Thank you!
The lecture delivery and content are very good.
However, since it is a lecture from about 3 years ago, there are many bugs due to the version mismatch.
As a beginner, it is not easy to match the version of the library, so it is difficult to proceed with the lecture.
It would be difficult to re-record the lecture,
but since this lecture is sold for a fee,
it is necessary to at least mention the method of resolving the version conflict for beginners.


![[Side Project After Work] Big Data Analysis Certification Practical Exam (Type 1, 2, 3)Course Thumbnail](https://cdn.inflearn.com/public/courses/329972/cover/dcfb28fd-48c1-4bb1-ab31-d59eac874194/329972-original.png?w=420)
![Complete Mastery of Big Data Analysis Certification Practical Exam Past Questions [Includes all previous sessions · Continuous updates · Dedicated practice environment provided]Course Thumbnail](https://cdn.inflearn.com/public/files/courses/342117/cover/01krvz68s4a416j2pjefmyvrff?w=420)

![[Renewed] Python Machine Learning Bootcamp for Beginners (Easy! Learn by Solving Real Kaggle Problems) [Data Analysis/Science Part2]Course Thumbnail](https://cdn.inflearn.com/public/courses/327464/cover/55c4db7b-7764-43cc-ac75-d9e8d08098f1/327464-eng.png?w=420)