inflearn logo

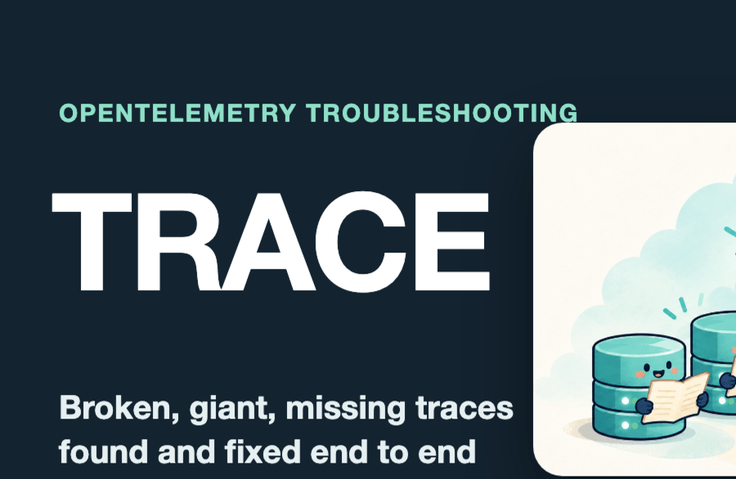
Hands-On Troubleshooting for Distributed Tracing — Catching Traces That Break and Disappear with OpenTelemetry

Reproduce firsthand the problems that arise in a microservice flow from order API → payment → inventory → Kafka → consumer → batch: traces breaking, growing to thousands of spans and silently being dropped, or disappearing from dashboards. Then fix them in symptom → diagnosis → resolution order, completing traces and dashboards that work end to end.

1 learners are taking this course

Level Intermediate

Course period Unlimited

grafana
grafana
Prometheus
Prometheus
Docker
Docker
Kafka
Kafka
MSA
MSA
grafana
grafana
Prometheus
Prometheus
Docker
Docker
Kafka
Kafka
MSA
MSA

What you will gain after the course

  • Determine with a few commands whether the trace split is caused by HTTP instrumentation, message headers, thread context, the propagation format, or sampling.

  • Use metrics to pinpoint where spans disappear without any app errors (collector queues, unflushed spans before shutdown, trace size limits).

  • We examine how batch and consumer workloads generate traces with thousands of spans, then redesign them using chunk spans, trace boundaries, and span links.

  • We find rootless, oversized traces caused by services that have sending disabled but propagation enabled, and resolve them with propagation policies.

  • Reassess automatic instrumentation spans, span names, and attribute cardinality, and use collector transformations and tail sampling to stay within the span budget.

  • After changing the observability stack, diagnose empty dashboards by checking for changes in metric names, units, and labels, then bring them back to life with recording rules.

  • When having an AI agent query observation data, limit the time window, number of results, and targets in code, and keep a record of the queries.

Final goal: Take a shopping mall order flow with five failures enabled, diagnose the causes from the symptoms alone, fix them one by one, and build with my own hands a single trace running from order to shipping and settlement, along with a dashboard brought back to life.

In a microservice system spanning the order API → payment → inventory → Kafka → consumer → batch, you’ll reproduce issues firsthand where traces break, balloon to thousands of spans and are silently dropped, or disappear from the dashboard, then fix them in the order of symptom → diagnosis → resolution to complete an end-to-end trace and dashboard.

Most tracing courses end after adding instrumentation and seeing traces appear on screen. This course goes further, covering what happens in production when traces break, grow, or disappear. We reproduce, one by one using failure switches, problems that look wrong only on screen even though the app reports no errors, and show every number as an actual measurement from the lab environment. We follow a single order flow involving Java and Python services, Kafka, and batch processing from start to finish, and at the end, we fix a scenario with all five failures turned on at once.

By the end of this course, you’ll be able to

  • When a trace splits in two, pinpoint the cause—HTTP instrumentation, message headers, thread context, propagation format, or sampling—with just a few commands.

  • Use metrics to pinpoint where spans disappear without application errors—such as in the collector queue, before flushing on shutdown, or due to trace size limits.

  • Understand how batch and consumer workflows create traces with thousands of spans, and redesign them using chunked spans, trace boundaries, and span links.

  • Find rootless, massive traces caused by services with span exporting disabled but propagation left on, and resolve them with propagation policies.

  • Reassess auto-instrumentation spans, span names, and attribute cardinality, and stay within the span budget using collector transformations and tail sampling.

  • After changing the observability stack, diagnose empty dashboards by checking for changes to metric names, units, and labels, then restore them with recording rules.

  • When allowing AI agents to query observability data, limit the time window, number of results, and targets in code, and keep a record of each query.

Recommended for these people

  • Backend developers running microservices-based commerce systems who hear that traces 'sometimes get cut off' or 'won’t open'

  • SRE and platform engineers who have adopted OpenTelemetry but aren’t sure what to look at in the Collector, Tempo, and Prometheus

  • Teams moving their observability stack from vendor products to open source, or finding their dashboards empty after the migration.

  • For those who need to define trace designs for Kafka consumers and batch jobs.

Curriculum (9 sections · 40 lessons · approximately 248 minutes)

  • Section 1. Getting Started — Final Project Demo and Course Roadmap

  • Section 2. Hands-on Environment and a Normal Trace — Bring up the Loopmarket order flow and observability stack, read a normal trace from beginning to end, learn the principles of context propagation — the Traceparent header, fault injection scripts, and diagnostic tools.

  • Section 3. Broken Traces — HTTP calls that don’t pass along headers — traces split in two, traces broken at message queues, parents disappearing in thread pools and asynchronous tasks, propagator mismatch — different header formats, traces with gaps due to inconsistent sampling decisions, spans silently dropped by the collector, batches ending without a flush — the last span is lost

  • Section 4. Giant Traces and Size Limits — Trace size limits — silently dropped when exceeded, lowering sampling doesn’t shrink an individual trace, batches that create a span for every loop iteration, consumers that don’t break traces for each message, switching to span links, designing trace boundaries for batch jobs, when large attributes inflate traces

  • Section 5. The Propagation-Only Trap — services with exporting disabled but propagation enabled, finding traces without roots, resolving it through propagation policies

  • Section 6. Span Cost and Cardinality — Disabling unnecessary auto-instrumentation spans, span name cardinality, attribute cardinality and span metric explosion, cleaning up in the collector — transforming and deleting, tail sampling — keeping only errors and slow traces, setting a span budget

  • Section 7. Empty Dashboards After a Stack Switch — Dashboards went blank after switching stacks, metric name changes — dots, units, and suffixes, label changes — service names and resource attributes, bridging and validating with recording rules, moving from logs to traces

  • Section 8. Querying Observability Data with an AI Agent — The Cost of Agent Queries — Time Windows Are Costs, Safety Rules in Code — Limited Query Tools, Finding the Root Cause with an Agent

  • Section 9. Capstone — Completing the Loop Market Trace — Capstone 1 — List of Loop Market Symptoms, Capstone 2 — Diagnosis, Capstone 3 — Resolution and the Complete End-to-End Trace, Capstone 4 — Dashboard Completion and Final Checklist

Lab Environment

The hands-on lab uses a virtual shopping mall called LoopMarket, launched with a single docker compose command. It’s a growing sports and outdoor retailer run by about a dozen developers, with traffic spikes mainly during its end-of-season sales and limited-edition product launches. All 11 services run on a single laptop: the order API (Java, with automatic instrumentation via a Java agent), payment, inventory, shipping consumer, and settlement batch (Python, using the OpenTelemetry SDK), Kafka, PostgreSQL, OTel Collector, Tempo, Prometheus, Loki, and Grafana. Use ./fault.sh to turn faults on and off, and the ./lm tool to inspect traces, metrics, and logs right away.

Prerequisites

  • Experience using Docker and Docker Compose (basic Mac/Linux terminal commands)

  • Basic concepts of HTTP APIs and message queues (Kafka)

  • A computer that can allocate at least 6 GB of memory to Docker (we’ll start 11 services at once for the hands-on exercises)

What This Course Does Not Cover

  • Those looking for only an introductory overview of OpenTelemetry installation and concepts (installation is covered, but troubleshooting is the main focus)

  • Kubernetes deployment and operator configuration

  • How to use specific commercial observability products

  • Application performance tuning itself

Notice

The slide narration is synthesized speech. All data is simulated for educational purposes, and the numbers may vary depending on the execution environment.

Recommended for
these people

Who is this course right for?

  • A backend developer running a microservices commerce platform who hears that traces “sometimes cut out” or “won’t open”

  • SREs and platform engineers who have adopted OpenTelemetry but aren’t sure what to look at in Collector, Tempo, and Prometheus.

  • Teams migrating their observability stack from vendor products to open source, or whose dashboards are empty after the migration.

  • For those who need to decide how to design tracing for Kafka consumers and batch jobs.

Need to know before starting?

  • Experience using Docker and Docker Compose (basic Mac/Linux terminal commands)

  • Basic Concepts of HTTP APIs and Message Queues (Kafka)

  • A computer that can allocate at least 6 GB of memory to Docker (we’ll run all 11 lab services at once)

Hello
This is dorian05202988

Career Verified

A data craftsman with over 20 years of experience in databases and IT. As a DBA and manager of a DB Platform team, I work with database platforms and specialize in MySQL, PostgreSQL, Oracle, MongoDB, SQL tuning, AWS, Terraform, and Python. Drawing on experience in the gaming, finance, and IT services industries, I explain database and cloud architecture. I have published 『Oracle Practical Tuning: Learning SQL Patterns』 and 『Oracle Pro*C Practical Project Guide』, and have presented on serverless architectures, database selection, and multi-database strategies at AWS Summit 2018 and 2019 and DataYa Nolja 2020. Recently, I have been working on slow-query analysis and tuning recommendations using Bedrock LLM, automated DB specification sizing, and query workflows through a DB metadata MCP server and Slack bot. I explain database automation for developers and AI applications for non-developers through hands-on exercises tailored to the audience and objectives of each course. Rather than applying AI suggestions as-is, I teach a decision-making framework that verifies result equivalence, execution plans, and observability conditions, and defers action when the supporting evidence is insufficient. Company operational data and credentials are not included in the course materials.

More

Curriculum

All

40 lectures ∙ (4hr 8min)

Course Materials:

Lecture resources
Published: 
Last updated: 

Reviews

Not enough reviews.
Please write a valuable review that helps everyone!

dorian05202988's other courses

Check out other courses by the instructor!

Similar courses

Explore other courses in the same field!

Limited time deal

$52,800.00

20%

$51.70