


Document Automation with R and Python (Basics)
statisticsplaybook
You can build the basic stamina to leave work on time by automating report writing.
Basic
RMarkdown, LaTeX, R
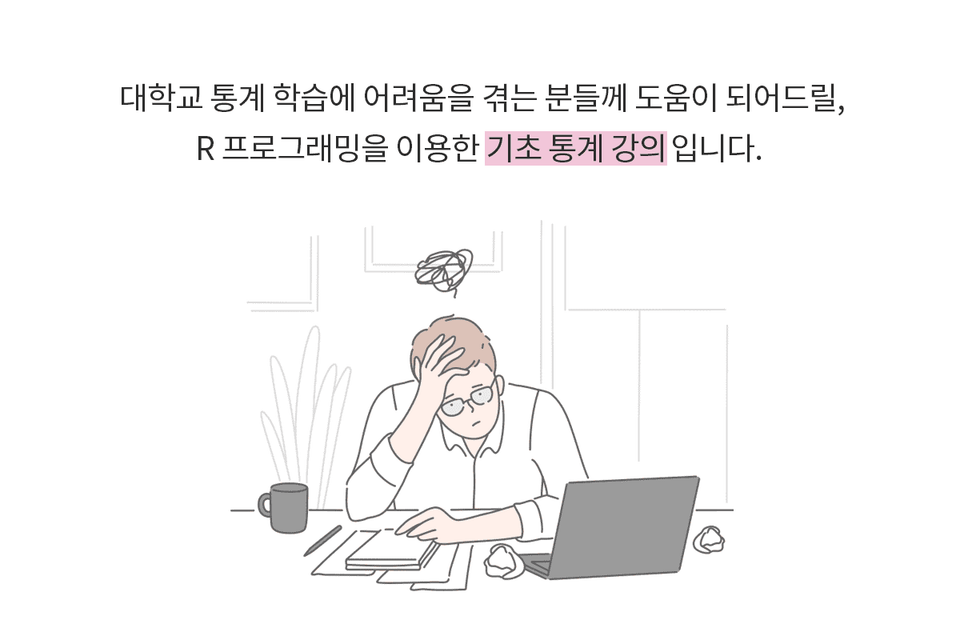
I think this course is the best for those who have taken statistics in college and been frustrated.
I think even those who are hearing statistics for the first time will gain a lot from it.
Since this is a class that uses the R statistical program, I think it will probably take some time to cover both statistics and programming.
This course is a statistics class, not a programming class. Therefore, the programming knowledge taught will be very basic, or only those essential to quickly grasp. I'll consider R -related courses later.
As someone who has studied and enjoyed statistics for a long time, I've created this course to help, given the lack of good statistical resources available online in Korean. I hope my lectures will be helpful to even those unfamiliar with statistics.
Anyone can learn anything. This is both my homepage motto and my motto. While studying statistics, or studying in general, you'll often find yourself frustrated by things you don't understand. Don't beat yourself up. It's not because you're stupid or lacking in study skills; it's more likely because you haven't followed the right study routine. Instead of thinking you can't do it, try to identify the gaps in your studies and work to fill them. I wish you the best of luck.
https://www.theissaclee.com/ko/courses/rstat101/
• Which way is it tilted, left or right?
• Which line is chosen for the regression line?
• Check the regression line optimization results
I'd like to share what I've learned and realized while studying statistics with those of you who are following my path. I hope this lecture will be a helpful resource, answering some of your questions. I also hope that for those who are following my path, I hope my footsteps will offer some comfort.
History
Academic background
I took the lecture with a little basic knowledge of R and no basic knowledge of statistics, but the lecturer first explained statistical calculation formulas step by step, then explained how to implement them by converting them into codes in R, and finally explained the order of functions that can be used in R, so I was able to learn the basic concepts of statistics and statistics using R at the same time. As the subtitle of Part (1) suggests, it seems like there is still a long way to go, but I am sad that the lecture is over. I hope to continue studying Parts (2)(3) in the future so that I can someday use R and statistical analysis in my thesis. I would like to thank the lecturer for providing such a high-quality lecture for free. Thanks to him, I learned a lot! (Oh, by the way, could you add video explanations to the regression analysis practice and multiple regression analysis sections of the blog?)
It helped me a lot.
It was a great help. Thank you for providing such a great lecture.
This is a great introductory lecture before starting R!! Other R lectures don't teach you knowledge of statistics, but this lecture teaches R and statistics together. If you want to catch two rabbits, R and statistics, I recommend taking this lecture first!!
thank you
![Advanced R Statistical Techniques Using LLM 2 [Advanced] [First Steps in Data Analysis with AI Tutor]Course Thumbnail](https://cdn.inflearn.com/public/files/courses/342657/cover/ai/1/28d2c2b1-6468-4408-9f00-af5877cbb5e1.png?w=420)
![R Statistical Techniques Using LLM [Introductory] [First Steps in Data Analysis with an AI Tutor]Course Thumbnail](https://cdn.inflearn.com/public/files/courses/342561/cover/ai/2/4e17e997-9033-40b9-b055-09b8fc496282.png?w=420)


![[Big Data Learning Center] *Free* 67th & 68th Open House - Bootstrapping and Structural Equation Modeling | Hierarchical Linear ModelingCourse Thumbnail](https://cdn.inflearn.com/public/files/courses/342202/cover/01krzgsx2bxpr2cy280qk257qp?w=420)