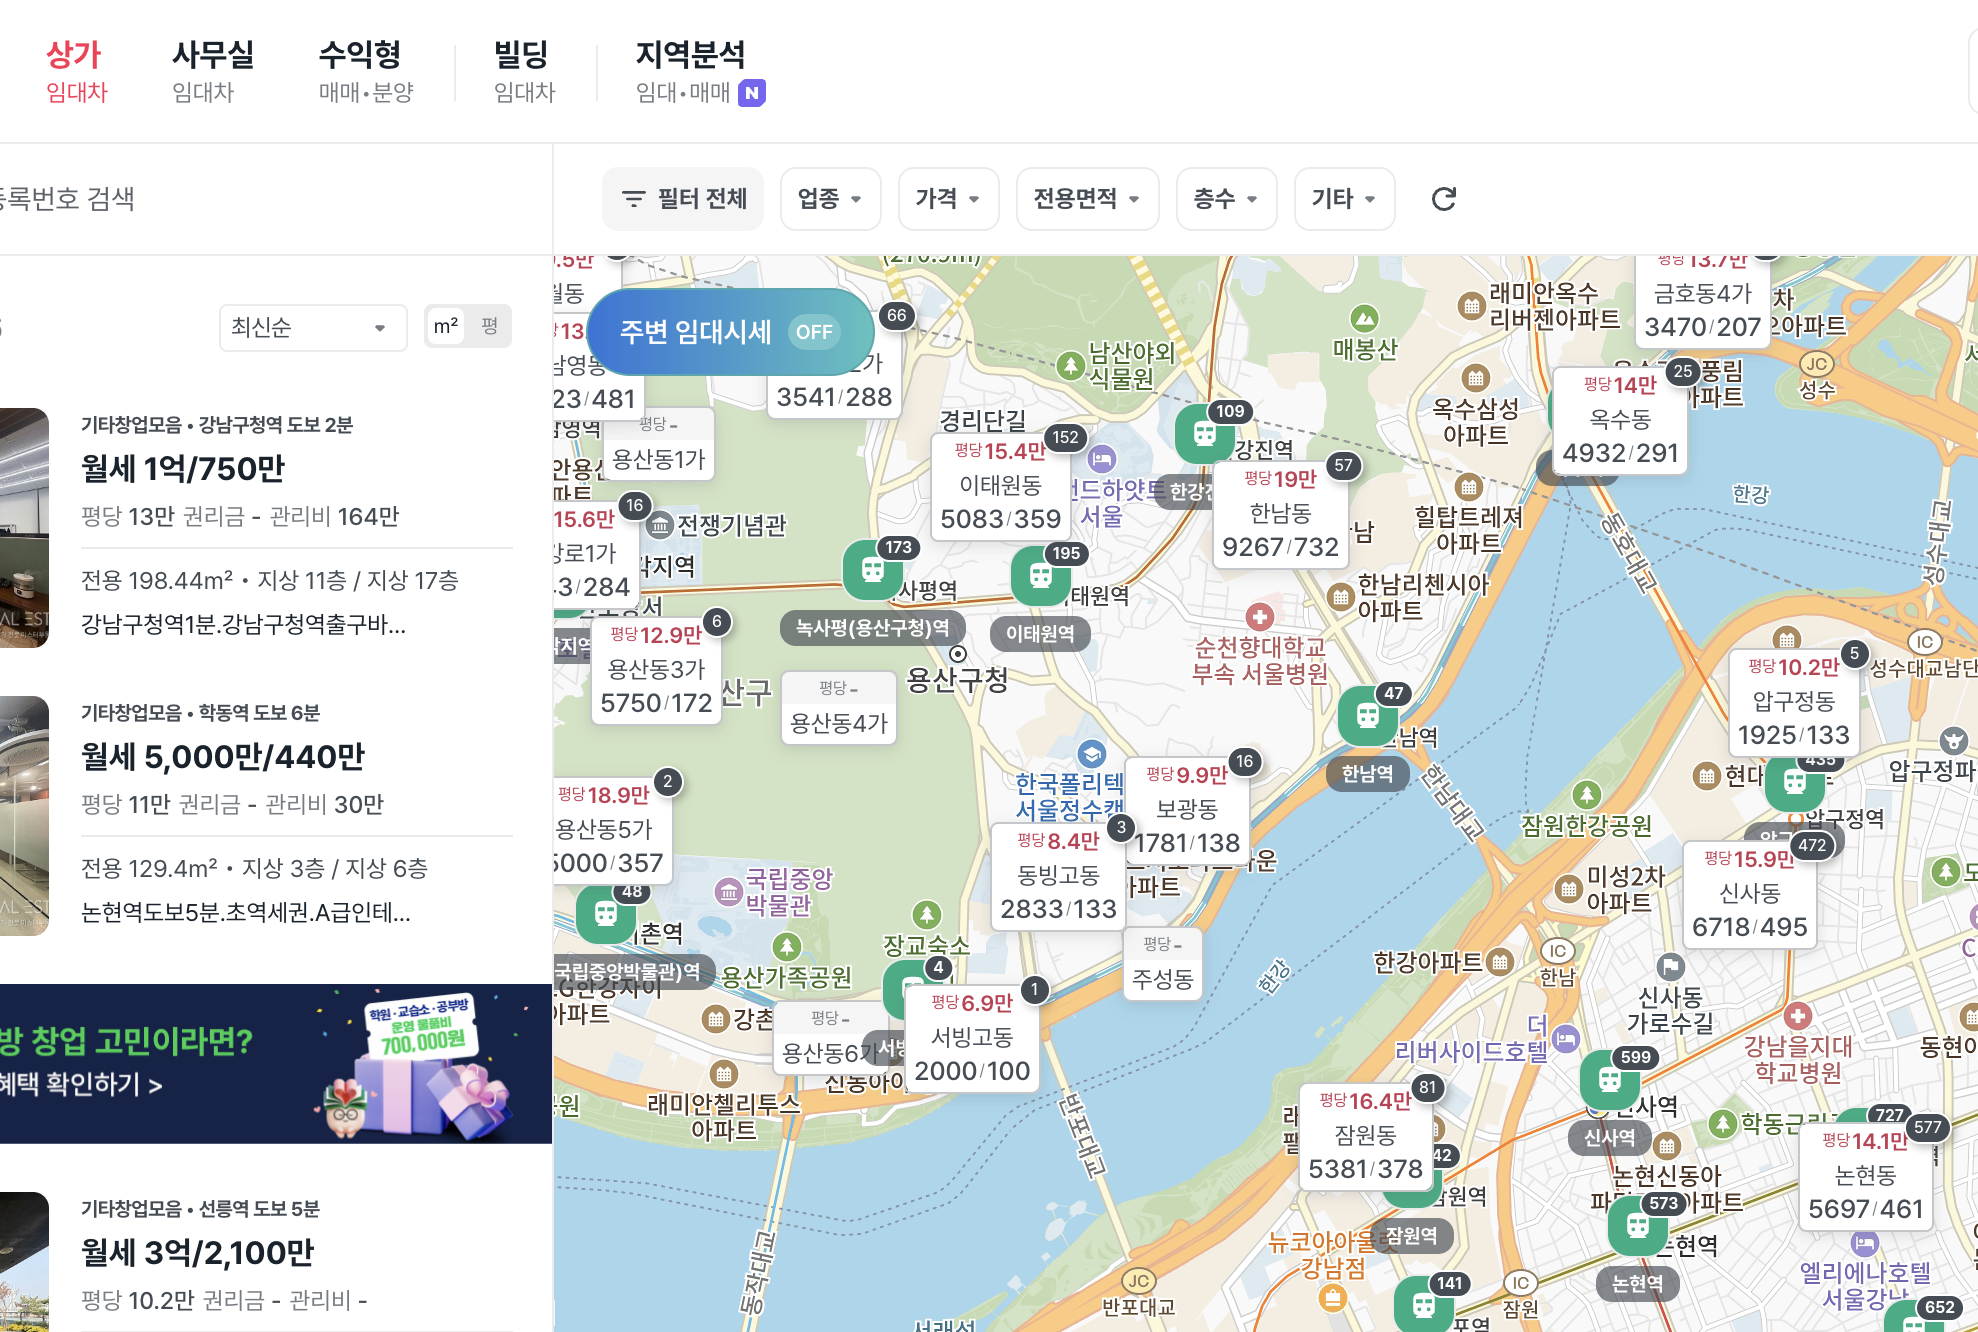
How long are you going to manually look through 2,500 stocks every day?
Searching through Naver Finance to find surging stocks after the market closes,
Reading news to judge whether it's good or bad news,
Checking foreign/institutional supply and demand one by one,
Opening charts to analyze patterns...
Aren't you repeating this every single day?
I used to do that too.
I spent 2 to 3 hours after work analyzing stocks, and yet I still missed more stocks than I found.
With over 2,500 stocks across KOSPI and KOSDAQ combined, it's impossible for a human to see them all every day.
---
So, I built a system.
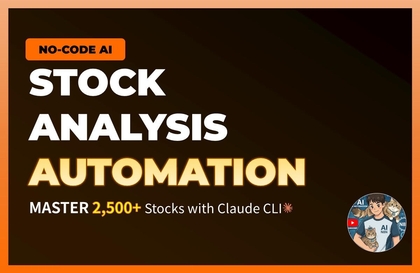
I created a system that automatically analyzes 2,500 stocks every day after the market closes.
- Automatically collects market prices, supply/demand, and news
- AI (Gemini) reads the news and determines if it's positive or negative
- Scores stocks out of 15 points based on 6 factors
- Selects only the stocks that pass the criteria and calculates entry, stop-loss, and take-profit prices
- Sends notifications via Telegram
Now, I just check my phone after work.
Additionally, every Saturday, the system analyzes its own performance from the past week
and automatically adjusts stop-loss lines, take-profit lines, and holding periods.
It is a structure where the system learns and improves on its own.
---
But I am not a developer.
I didn't write the code for this system myself.
I gave all the instructions to the AI verbally.
"Filter out stocks that rose more than 5% today with a trading volume exceeding 50 billion won."
"Send these 3 news articles to Gemini and have it judge if they are positive."
"Create a scheduler so this runs automatically every day at 4 PM."
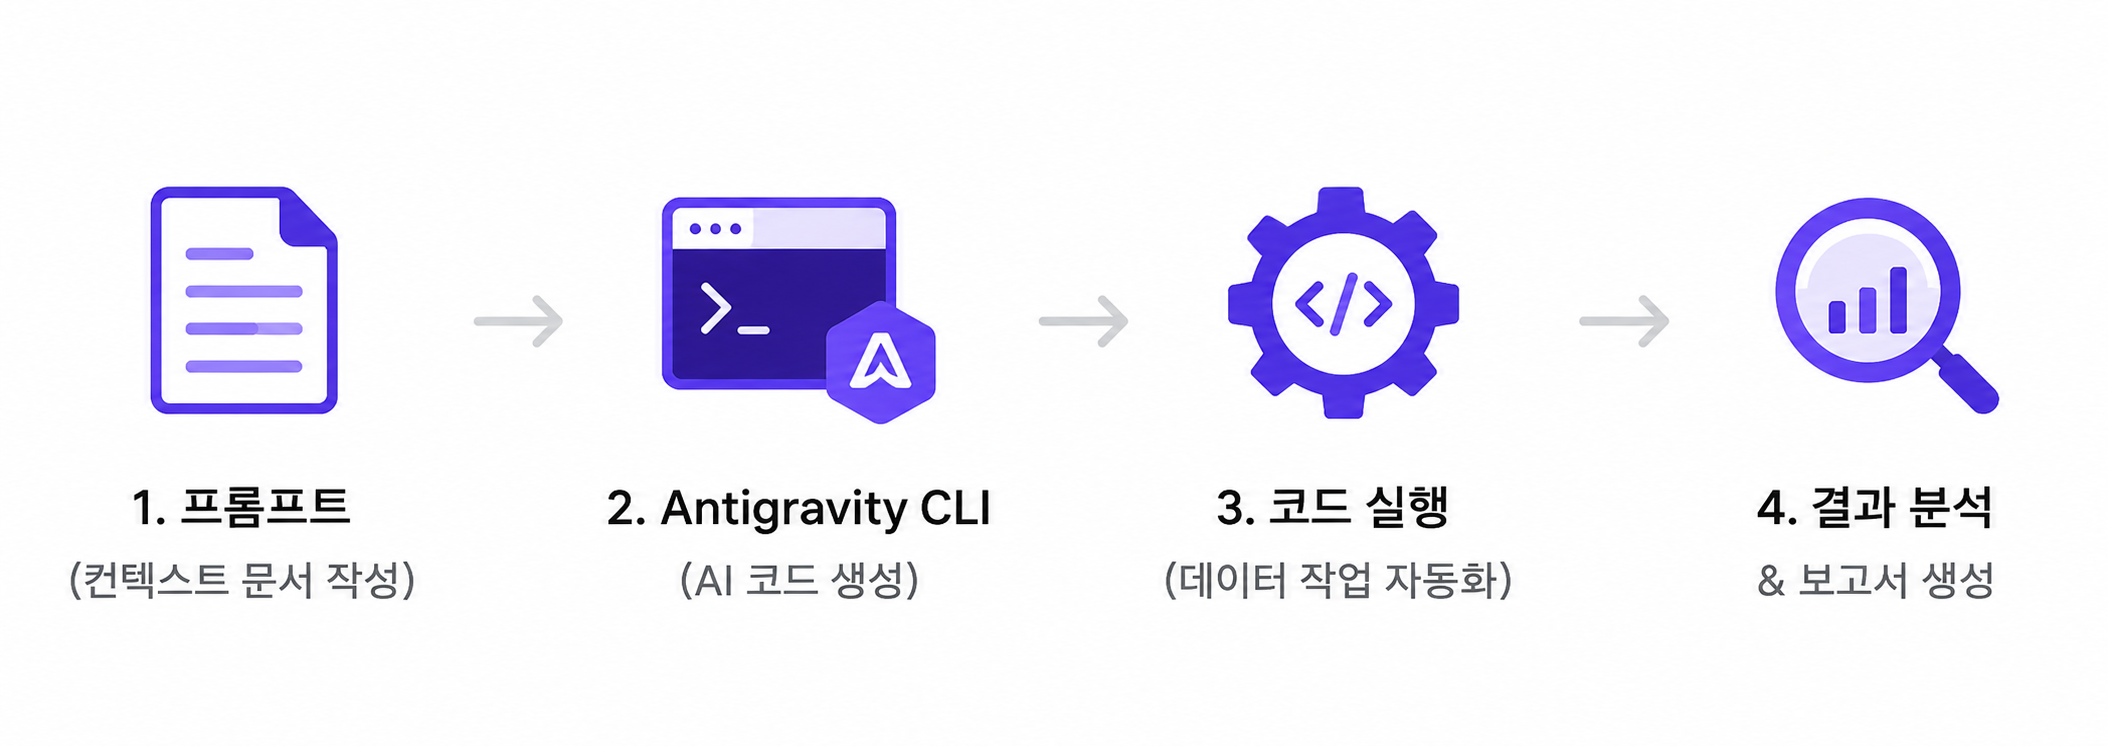
When I speak like this, the AI (Claude) generates the code.
This is "Vibe Coding."
---
In this course, we will build this exact system.
Over 58 lessons, we will build the system I actually use every day from start to finish.
Starting from data collection,
AI news analysis, scoring engine, signal generation,
Flask API server, Next.js web dashboard,
Telegram automatic notifications, and even the self-learning system.
The final product is not a Jupyter Notebook.
The final product is a web dashboard and Telegram notifications that actually run every day.
You don't need to know how to code.
In every lesson, I will show you how to talk to Claude,
and if you follow along, you will get the same results.
---
Recommended for:
- Office worker investors who lack the time to analyze stocks every day
- Those who want an automated system but don't know how to code
- Those curious about quant/system trading but don't know where to start
- Those curious about how to utilize AI in practice
---
⚠️ This course does not guarantee investment returns.
This is a programming course on building your own stock analysis tools.
Actual investment decisions are the responsibility of the student.


![Just 1 hour! Creating 'My Own AI Senior Developer' to install on my computer (Antigravity Vibe Coding) [Source code provided]Course Thumbnail](https://cdn.inflearn.com/public/files/courses/340332/cover/ai/3/e87ee52b-1099-42db-a384-64ab8c725470.png?w=420)
![[New Revised Edition] This is Real Crawling - Practical Edition (AI Monetization)Course Thumbnail](https://cdn.inflearn.com/public/courses/328045/cover/aec69a0c-6a3c-4602-b4a0-62d492398c12/328045.png?w=420)
![[PL 0302] Python for Data Manipulation - NumPy MasterclassCourse Thumbnail](https://cdn.inflearn.com/public/courses/334756/cover/a4cbdc80-53da-4422-9b8d-67362b68a9fa/334756.png?w=420)


![[Renewal] First-time SQL and Database (MySQL) Bootcamp [From Beginner to Application]Course Thumbnail](https://cdn.inflearn.com/public/courses/324208/cover/85872a8e-d2bb-4c43-82fc-d55fa067746e/324208.png?w=420)
![Complete Mastery of Big Data Analysis Certification Practical Exam Past Questions [Includes all previous sessions · Continuous updates · Dedicated practice environment provided]Course Thumbnail](https://cdn.inflearn.com/public/files/courses/342117/cover/01krvz68s4a416j2pjefmyvrff?w=420)