Finding Signals and Noise through Python Stock Data Collection and Analysis
This is not an investment lecture. It covers data collection, analysis, and visualization using stock market data. You will work with various data formats and learn various text preprocessing techniques. It covers visualization techniques for time-series data, methods for representing scales, and several techniques for interpreting stock price data. This course is about learning how to gain insights through data analysis. It is designed so that the concepts learned through stock price data can be applied to collecting, analyzing, and visualizing other time-series data such as demand, inventory, sales, and traffic volume.
I think this is the best lecture ever!!! I've taken many lectures, but I think this is the first time I've learned as much and been helped as much by Professor Park Jo-eun's lecture! There are times when I get confused by grammar rules and think, "Hmm... why is that like that?", but after the teacher explains the concept, she would say on the video, "There are many people who ask, "Why isn't this grammar rule valid?" and she would answer my questions exactly as they were. I remember being so surprised every time I took the class. ㅋㅋㅋㅋ It was a really helpful class, and the class on analyzing stock data was so fun that I finished all the lectures in less than a month! All of you who are thinking about it, you won't regret your choice! If you are thinking about it, sign up for Professor Park Jo-eun's lecture right away!!!! 5 stars!
5.0
hakjuknu
94% enrolled
Great!
5.0
moonchoh
100% enrolled
I took the class because I was interested in stocks.
It's a little past the beginning of the lecture, but
I'm looking forward to the end ^^
What you will gain after the course
Web scraping, not crawling
Collecting stock price information in a single line using FinanceDataReader
Collecting data with just one or two lines of Pandas code
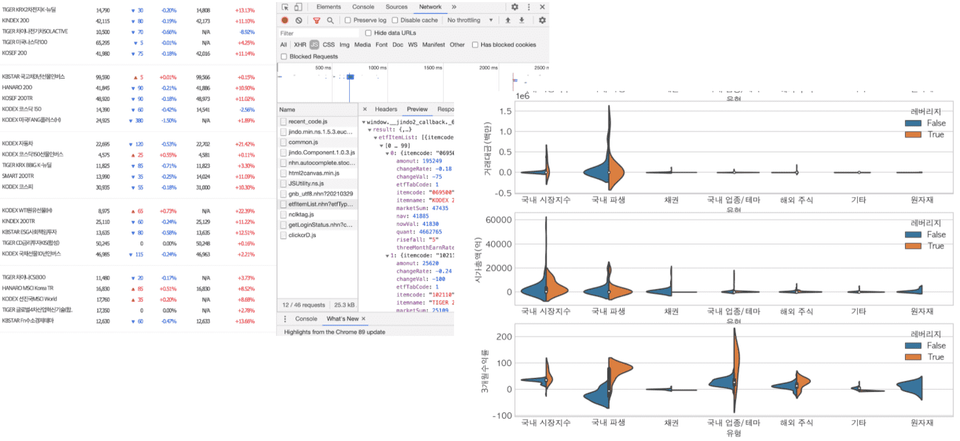
How to collect data without complex coding, based on an understanding of the browser's network tab
Handling JSON File Formats
Handling time series data and exploring various operations using diff and shift
Calculating Daily and Cumulative Stock Returns
Differences and usage methods of seaborn, plotly, pandas plot, and matplotlib
### 1. Matplotlib
* **Characteristics:** The most basic and foundational library for Python data visualization. It offers high flexibility, allowing you to control every element of a plot, but requires a lot of code to create complex visualizations.
* **Usage:** Used for low-level control or when creating custom plots that are not supported by other libraries.
* **Key Command:** `plt.plot()`, `plt.show()`
### 2. Seaborn
* **Characteristics:** A library built on top of Matplotlib. It provides high-level interfaces for drawing attractive and informative statistical graphics. It works well with Pandas DataFrames and offers beautiful default themes.
* **Usage:** Used for statistical data analysis (e.g., heatmaps, violin plots, joint plots) and when you want to create aesthetically pleasing charts with minimal code.
* **Key Command:** `sns.heatmap()`, `sns.scatterplot()`
### 3. Pandas Plot
* **Characteristics:** A built-in visualization feature within the Pandas library. It internally uses Matplotlib, allowing you to create simple charts directly from DataFrames or Series objects.
* **Usage:** Used for quick data exploration and simple visualization immediately after data processing.
* **Key Command:** `df.plot()`, `df.hist()`
### 4. Plotly
* **Characteristics:** An interactive visualization library. Unlike the static images produced by Matplotlib or Seaborn, Plotly allows users to zoom, pan, and see data values on hover. It is widely used for web-based dashboards.
* **Usage:** Used when interactivity is required or when building web-based data applications (e.g., Dash).
* **Key Command:** `px.scatter()`, `fig.show()`
---
### Summary Table
| Library | Base | Interactivity | Complexity | Main Purpose |
| :--- | :--- | :--- | :--- | :--- |
| **Matplotlib** | Independent | Static | High | General purpose, detailed customization |
| **Seaborn** | Matplotlib | Static | Low | Statistical analysis, aesthetic plots |
| **Pandas Plot** | Matplotlib | Static | Very Low | Quick preview of DataFrames |
| **Plotly** | JavaScript | Interactive | Medium | Interactive charts, dashboards |
Interactive visualization techniques using Plotly and Cufflinks
Pandas filter, merge, concat, and text preprocessing methods
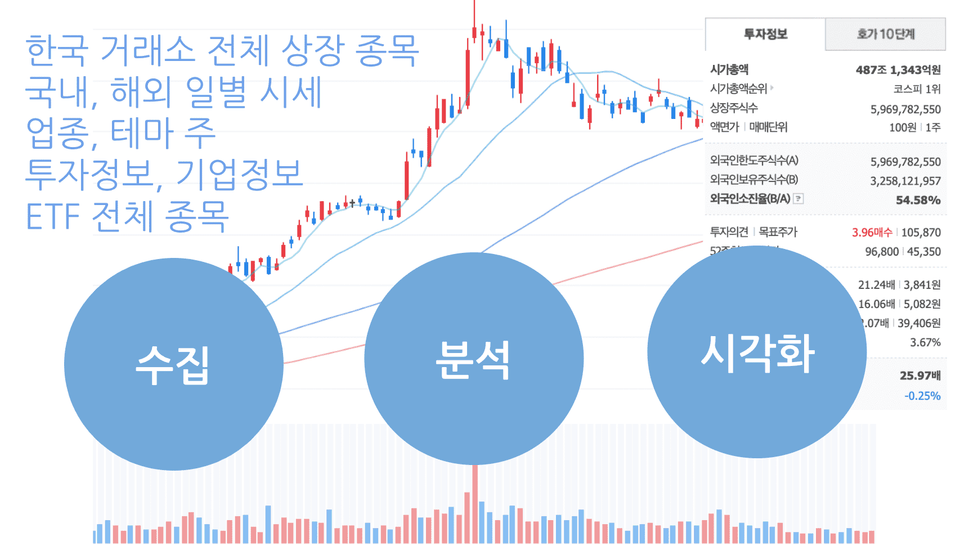
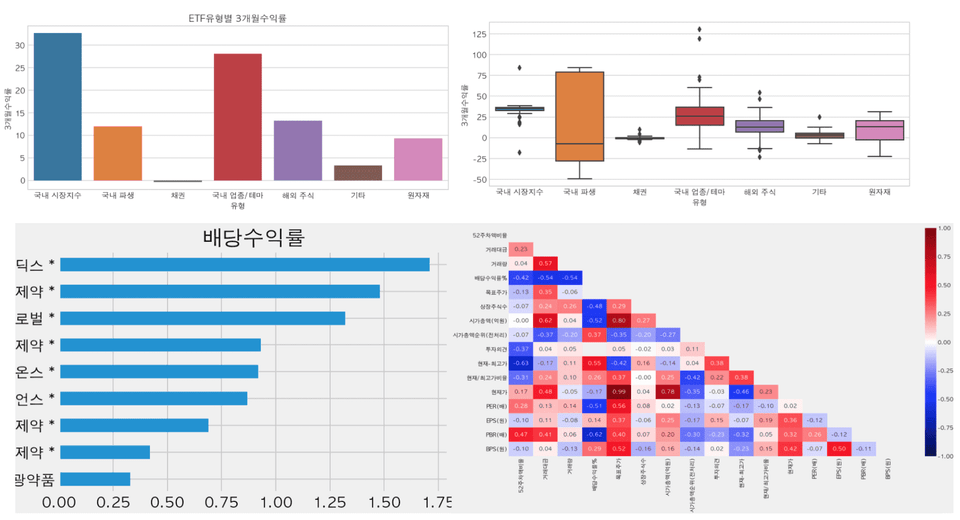
How to collect and analyze all ETF, industry, and theme stocks
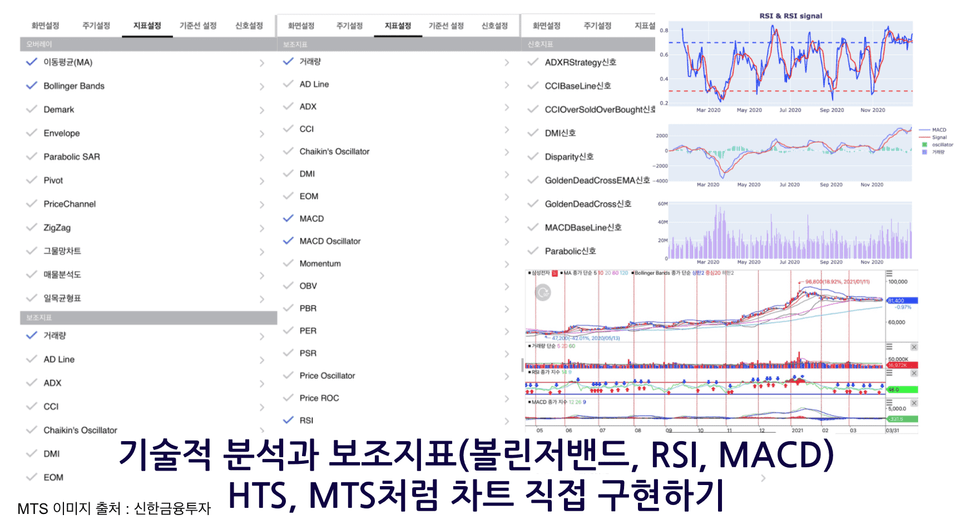
Implementation and understanding the principles of technical indicators such as Bollinger Bands, MACD, and RSI
Understanding terms for stock market beginners: PER, EPS, BPS, PBR, ETF, Inverse, Leverage, Currency Hedge, etc.
Learn everything from A to Z about data using stock market data, from collection to analysis and visualization!
Finding signals and noise within data, and gaining more insights! 📈
Everyone, are you familiar with the book <The Signal and the Noise>? We try to predict an uncertain future and find insights through data analysis and visualization. That is why finding the signals and noise within vast amounts of data is the job of a data analyst.
This lecture starts from exactly that perspective. It involves receiving and analyzing stock price data, which is rising and falling even at this very moment, in real time.
In this course, we will go through the three stages of data collection/preprocessing - analysis - visualization,
Instead of using data collected by someone else, we will learn how to collect and preprocess the data ourselves.
The goal is to learn and apply data analysis methods for use in work or research.
Data Analysis, Why should you learn it using stock market data? 📊
What if you have to copy and paste the contents of dozens or hundreds of web pages into Excel?
What if the collected data is so messy that you don't even know where to start?
If you don't know how to apply the statistical terms you learned in middle school?
👉 If you related to this, now is the time to build your fundamental data skills!
Did you know that Pandas, the Python data analysis library, was developed by a quant working on Wall Street? Stock market data is a type of data where you can apply various analysis methods, formulas, and statistics.
What the differences are between categorical and numerical data, and what the appropriate visualization methods are to find signals and noise in data... By analyzing stock market data, you can learn how to handle data in various formats.
Building fundamental data skills through stock data analysis.
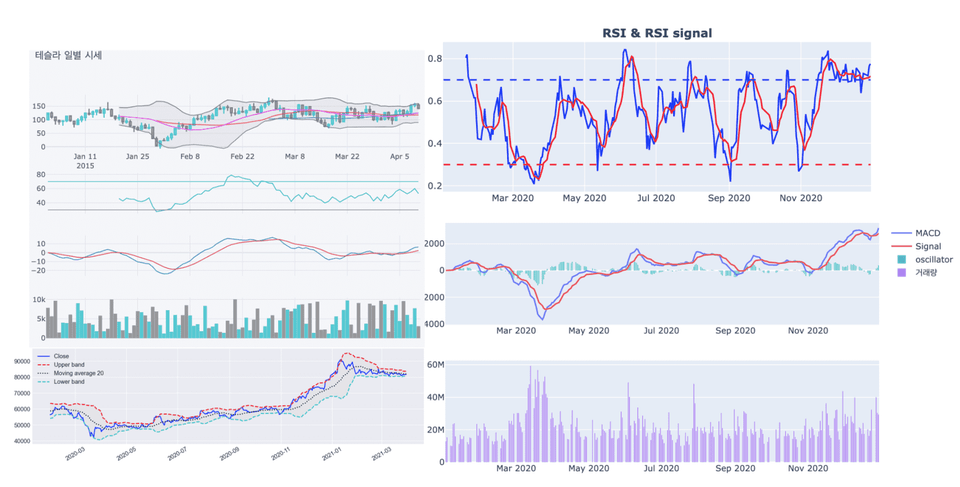
✅ You will also directly implement technical analysis indicators such as Moving Average, Bollinger Bands, MACD, and RSI, and
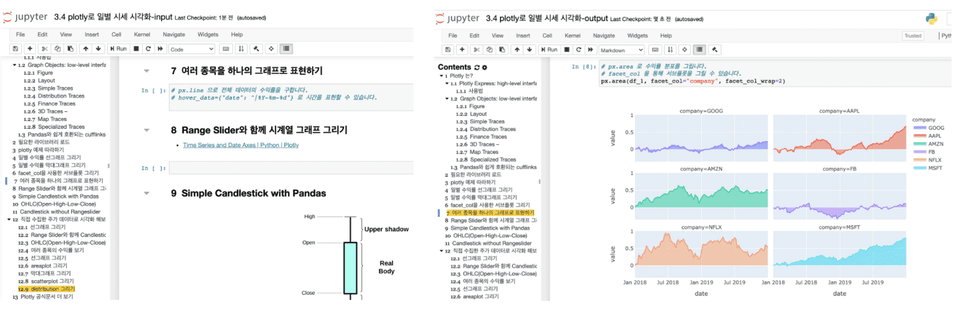
✅ You will also draw charts with just a line or two of code using pre-implemented libraries.
✅ Understand the principles of technical analysis and implement charts just as you see them on HTS or MTS.
Who is this for? 🔍
Those who want to learn data analysis using live data
Those who want to get started with data analysis using Python
Those who want to learn how to collect and preprocess data
Those who want to implement/analyze auxiliary indicators such as Bollinger Bands, MACD, and RSI
📢 Please check the prerequisite knowledge!
This course is at a beginner level or higher and requires the following prerequisite knowledge.
How to read Excel-style tables (Understanding rows and columns)
Basic arithmetic operations and middle school-level mathematical knowledge
Understanding of mean, median, percentage, variance, and standard deviation
Understanding of Python strings, numbers, lists, and variables
Here are the unique key features of this course. ⚡️
One, collect data with just a line or two of code 🧹
We will explore how to collect data from web pages—which previously seemed to require heavy tools like Selenium—in just one or two lines of code by utilizing the browser's network tab. You will be able to directly collect and analyze the information necessary for your work or research.
Second, dynamic visualization tools are also OK. 📈
In this course, you will learn how to use not only static visualization tools but also dynamic ones. Through dynamic data visualization, you will be able to effectively convey and implement more extensive and complex information than when representing data using only static visualization tools.
Third, we help you develop the ability to see the big picture 🧰
It is difficult to learn many tools all at once. You only need to understand the core functions. If you know how to read and understand documentation, you won't be afraid when new libraries emerge, even if the tools change.
Four, libraries for convenient use! 💡
The functions we feel we need have already been created by someone as abstracted libraries. We will learn how to install and familiarize ourselves with new tools. You can use them conveniently when actually analyzing data.
Fifth, we provide comprehensive practice materials. 💻
We provide two types of practice materials: a file without code (input) and a file with code (output). You can follow along with the lecture by typing the code yourself into the empty cells provided with instructions, or you can practice by running the file that already contains the code. Alternatively, you can use the empty cells to review and test your knowledge after finishing the lecture.
The course includes a process where you can understand the principles by directly implementing and displaying various auxiliary indicators (Moving Average, Bollinger Bands, RSI, MACD, etc.) found in securities firms' HTS and MTS on visualized charts. It is helpful for those who want to learn how to directly implement and analyze various technical indicators.
Two types of practice materials are provided: files without code (input) and files with code (output)
Directly implement and understand the principles of auxiliary indicators (Moving Average, Bollinger Bands, RSI, MACD) available on HTS and MTS
With just one lecture, you can learn this many skills. 📌
A one-line introduction to the skills you will learn in this course!
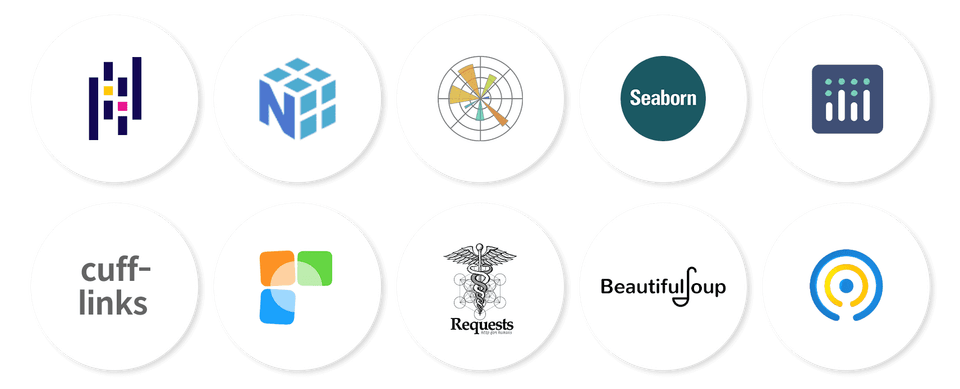
🐼 Pandas: Python's representative data analysis tool, originally created for financial data analysis.
🧮 Numpy : This is a numerical calculation tool for Python.
📊 matplotlib : This is Python's representative data visualization tool.
📊 seaborn : A high-level visualization tool that abstracts matplotlib for ease of use and provides basic statistical operations.
📊 plotly : Provides both high-level and low-level visualization features and enables interactive visualization.
📊 cufflinks : A productive tool that powerfully connects plotly and pandas.
📈 FinanceDataReader: A tool that allows you to collect financial data with just one or two lines of code.
🌏 Requests: A tool that allows you to retrieve the source code of web pages via HTTP communication.
🔍 BeautifulSoup4 : A tool that allows you to extract the information you want from a web page's source code.
⏰ tqdm : A tool that allows you to view the progress of time-consuming tasks in data collection or preprocessing.
Check out what you're curious about first! 🙋♀️
Q. Can non-majors take this course?
Data analysis is useful in many areas regardless of whether you are a major or non-major. If you learn data analysis techniques using Python instead of Excel, you can apply them to various tasks in both work and research. I have already conducted corporate training for non-development roles using this curriculum in an offline setting. I have also conducted various interviews regarding the difficulties people face in the field and supplemented the curriculum accordingly. Mastering the core functions for analysis and visualization will help improve your work efficiency.
Q. Why should I learn data analysis and collection skills using Python?
Excel is one of the essential skills for any office worker, regardless of the task. However, Excel has limitations in terms of the size and types of data it can load; by learning Python, you will be able to handle various formats and large-scale data.
Q. What are the benefits of learning data analysis and collection techniques?
There are often times when you have to perform repetitive tasks, such as flipping through pages and using drag-and-drop or copy-paste to collect the data you need. You can now leave these tasks to Python ⏰ and spend your time on more productive work or take a break 🧘♀️ instead.
Q. Is there anything I need to prepare before taking the course?
It is helpful to have an understanding of Python concepts such as variables, numbers, strings, and lists. Additionally, middle school-level mathematical knowledge, including mean, median, variance, standard deviation, and percentiles, is required.
Q. To what level of depth does the course cover?
We collect, preprocess, analyze, and visualize stock market data. The course covers Python skills from basic to intermediate levels. The difficulty increases significantly starting from the collection of industry theme information. The goal is to enable various roles—such as planning, marketing, sales, and operations—to directly utilize data analysis. If you are new to programming, you might find it challenging from the middle of the course onwards. In such cases, I recommend running the completed files (those with "output" at the end of the filename) provided by the instructor, then creating a code cell directly below to practice by copying the code exactly.
Q. What level of computer performance is required to take the course?
Any PC or laptop with at least 4GB of RAM and about 20GB of free storage space will be fine. If your computer's performance is low, you can use Google Colaboratory for the hands-on exercises.
Q. Can I organize and publish the course content on my personal blog or GitHub?
Copyright notices are provided on the corresponding lecture GitHub. When organizing and publishing the content, please include a citation of the source.
Please check before taking the course! ⚠️
Those who want predictions through time series models such as ARIMA, machine learning, or deep learning: This course mainly covers data collection, preprocessing, analysis, and visualization. It does not include the process of predicting future data.
Those who want automated trading: We do not use securities company APIs related to automated trading.
Those who expect to earn high profits in the stock market by learning data analysis: This is a data analysis course, not a stock investment course. Unfortunately, you may be disappointed if you are expecting investment-related skills. Furthermore, even if you invest using the analysis techniques learned in this course, the responsibility for any investment losses lies with the investor.
Inflearn Preview or some lessons released through the YouTube channel, please listen to them first before deciding whether to take the course.
You can preview some of the lessons before enrolling. Please check if it aligns with your desired learning direction. Also, if you have any questions, feel free to ask through the pre-enrollment inquiry.
Curious about the knowledge sharer who created this course? 👩💻
Interview with Knowledge Sharer Jo-eun Park X Inflearn
Recommended for these people
Who is this course right for?
Those who want to learn analysis and visualization using stock data rather than for investment purposes.
Those who want to learn data analysis through live data
Those who want to get started with Python data analysis
Those who want to learn data collection methods
Those who want to learn how to preprocess collected data
How to directly implement and analyze technical indicators such as Bollinger Bands, MACD, and RSI
Need to know before starting?
How to read an Excel-style table (Understanding rows and columns)
Basic arithmetic operations and middle school-level mathematical knowledge
Understanding Mean, Median, Percentage, Variance, and Standard Deviation
Understanding Python strings, numbers, lists, and variables
Instructor and Curriculum Designer for Data Science at Naver Connect Foundation Boostcourse
Seoul National University Big Data Innovation Sharing University, Seoul National University Continuing Education Center, Yonsei University DX Academy, Hanshin University ABC Camp, Hanyang University Graduate School, Chonnam National University,
Lectured at numerous educational institutions and corporations, including Korea Management Association (KMA), IGM Institute for Global Management, Samsung SDS Multicampus, LIKE LION, Fast Campus, Modulabs, and National Cancer Center.
Corporate data analysis across various domains (pharmaceuticals, telecommunications, automotive, commerce, education, government agencies, etc.)
Over 20 years of professional experience as a web backend developer and data analyst across various domains, including gaming, advertising, and education.
I am a liberal arts student who has been living a life of being indifferent to programming, but I wanted to get started with data analysis, so I took the public data lecture and took the class. I am a liberal arts student, but I think I am starting to get the hang of it after listening to it repeatedly! I thought I would be able to apply Python in various places in the future by learning how to use libraries and how to view documents and help. I think it will be very helpful for future visualizations because it covers various Python data visualization tools. Thanks to this, I also gained some knowledge about securities.
I think this is the best lecture ever!!! I've taken many lectures, but I think this is the first time I've learned as much and been helped as much by Professor Park Jo-eun's lecture! There are times when I get confused by grammar rules and think, "Hmm... why is that like that?", but after the teacher explains the concept, she would say on the video, "There are many people who ask, "Why isn't this grammar rule valid?" and she would answer my questions exactly as they were. I remember being so surprised every time I took the class. ㅋㅋㅋㅋ It was a really helpful class, and the class on analyzing stock data was so fun that I finished all the lectures in less than a month! All of you who are thinking about it, you won't regret your choice! If you are thinking about it, sign up for Professor Park Jo-eun's lecture right away!!!! 5 stars!


![Complete Mastery of Big Data Analysis Certification Practical Exam Past Questions [Includes all previous sessions · Continuous updates · Dedicated practice environment provided]Course Thumbnail](https://cdn.inflearn.com/public/files/courses/342117/cover/01krvz68s4a416j2pjefmyvrff?w=420)
![[Renewed] MongoDB and NoSQL (Big Data) Database Bootcamp for Beginners [From Introduction to Application] (Updated)Course Thumbnail](https://cdn.inflearn.com/public/courses/324183/cover/fbe9f0cc-4c42-4435-b855-f283f6932415/324183.png?w=420)