Getting started with data analysis with Kaggle surveys
What is Kaggle? Every year, Kaggle conducts a survey of users around the world. When you want to learn data science, you may have many questions.
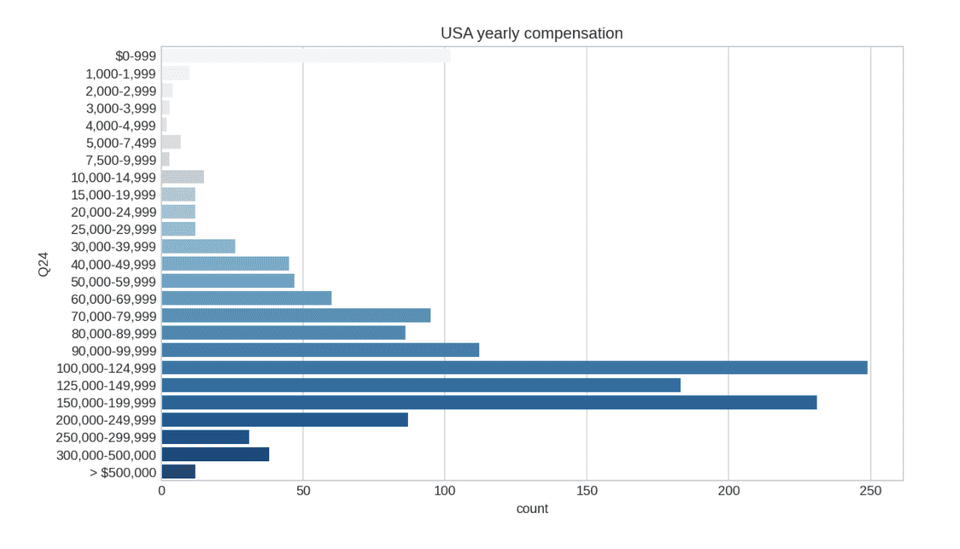
Is it too late to start? Which language should I choose between Python and R? How much is the salary?
Find out by reading the responses from users around the world!
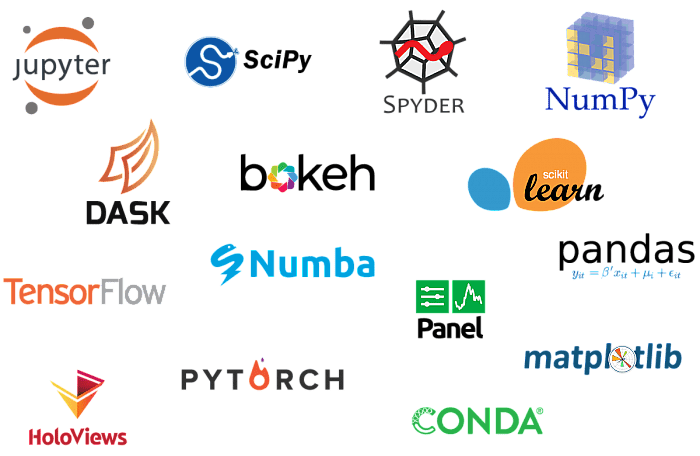
With just a few powerful features of Pandas, you can perform frequency analysis and data visualization.
I was curious about Kaggle and data analysis.. Thank you for telling me~! I will also sign up for the paid lecture and study hard.
5.0
수원양민
100% enrolled
Thank you for the great lecture.
5.0
Jang Jaehoon
31% enrolled
Thank you for the great lecture!
What you will gain after the course
How to use kaggle notebook
Handling DataFrame and Series Type Data with pandas
Indexing data via pandas' loc
Calculating frequency with pandas value_counts
Visualizing frequency with seaborn countplot
Drawing a bar graph with seaborn barplot
Finding response frequency for multiple questions using pd.crosstab
Sorting data with sort_index() and sort_values()
How to use pandas filter
Kaggler's secrets revealed through data! Now, take your first step into data analysis.
What are Kagglers around the world thinking?
Data Analyst , Data Scientist , I want to become a machine learning engineer ... If you don't have anywhere to ask and have a lot of questions?!
Analyze it with data!
Maybe this will help you a little bit to solve your problem.
There are several choices for data beginners.
If you are wondering what to choose ?
The answer might be in the data!
Pythonvs.Rvs.SQL
scikit-learnvs.TensorFlow
MatplotlibvsSeabornvsPlotlyvsggplot
Jupytervs.VS Codevs.PyCharm
AWSvs.MS Azurevs.GCP
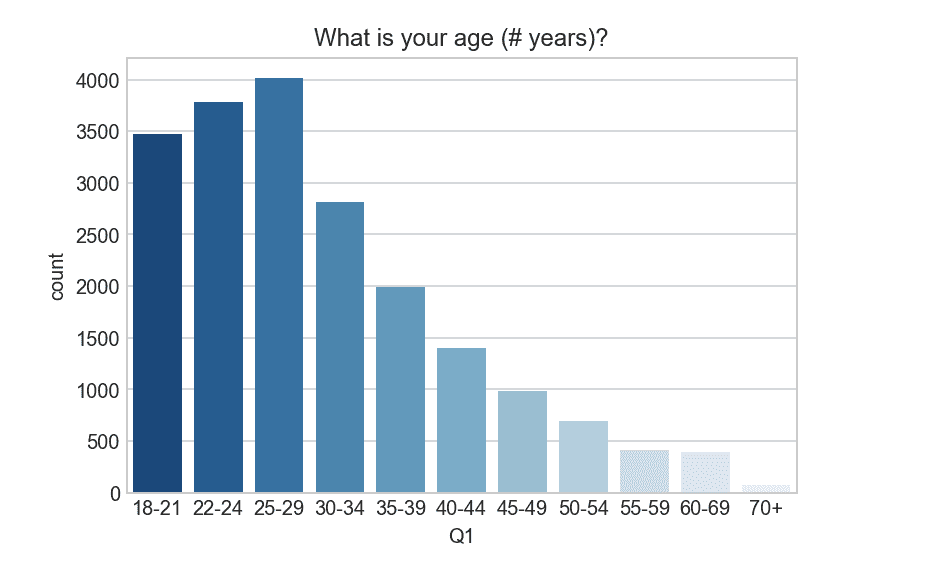
Is it too late to start data science?
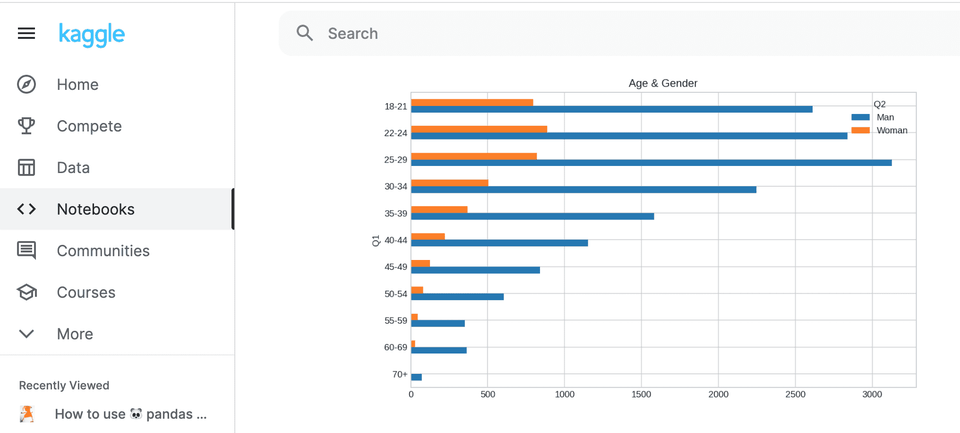
👉 What are the gender and age range of Kagglers?
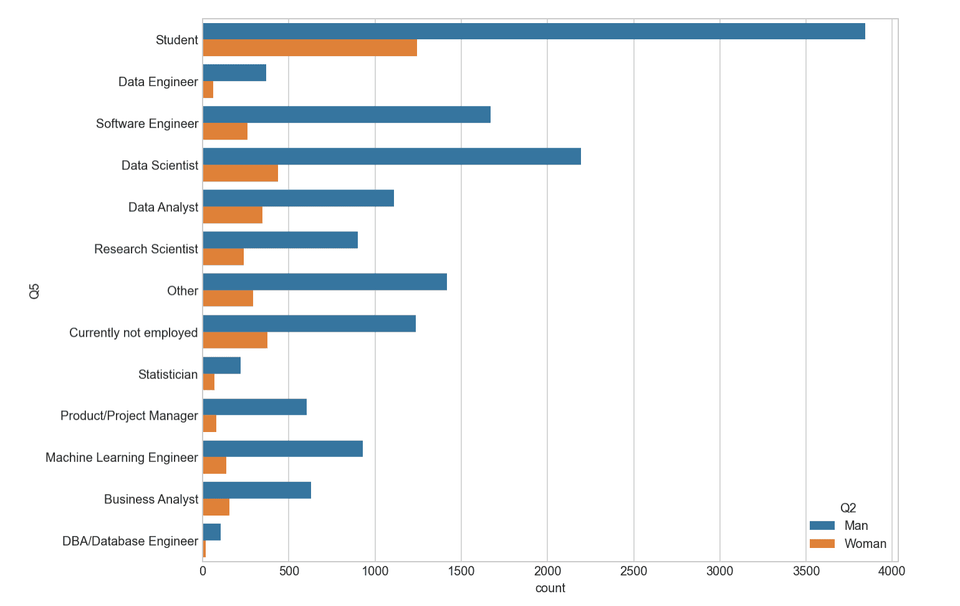
Where do Kagglers mostly live and what occupations do they have?
👉 Data analyst? Scientist? Machine learning engineer? Programmer?
What languages do Kaggle users primarily use, and which languages would you recommend as a beginner language?
👉 Python vs R vs SQL? 👉 Jupyter? VS Code? PyCharm? Which editor should you use? 👉 Will the gender ratio of Kagglers change by age group? 👉 Also, are there differences in language use and occupation depending on gender?
Learn about Kagglers' interests and demographics through simple frequency analysis.
What if you have to do the same task over and over again? Create a function to reduce the amount of repetitive work. I'll create a function that automatically analyzes the frequency by simply passing in the question number!
Try practicing by simply logging into Kaggle without any separate installation or download!
⚠️ Things to note before taking the class
We will not teach the basics of Python or Pandas, but will proceed directly to analysis.
We will not go into detail about how to use Python, Pandas, or visualization.
We only cover a few skills for survey analysis.
If you have no experience with Python, Pandas, or visualization, you may have difficulty taking the course.
We'll cover only the skills of how to directly check the responses to 39 questions with code and analyze them in a simple way.
Instructor and Curriculum Designer for Data Science at Naver Connect Foundation Boostcourse
Seoul National University Big Data Innovation Sharing University, Seoul National University Continuing Education Center, Yonsei University DX Academy, Hanshin University ABC Camp, Hanyang University Graduate School, Chonnam National University,
Lectured at numerous educational institutions and corporations, including Korea Management Association (KMA), IGM Institute for Global Management, Samsung SDS Multicampus, LIKE LION, Fast Campus, Modulabs, and National Cancer Center.
Corporate data analysis across various domains (pharmaceuticals, telecommunications, automotive, commerce, education, government agencies, etc.)
Over 20 years of professional experience as a web backend developer and data analyst across various domains, including gaming, advertising, and education.


![[Side Project After Work] Big Data Analysis Certification Practical Exam (Type 1, 2, 3)Course Thumbnail](https://cdn.inflearn.com/public/courses/329972/cover/dcfb28fd-48c1-4bb1-ab31-d59eac874194/329972-original.png?w=420)
![[Renewed] Python Machine Learning Bootcamp for Beginners (Easy! Learn by Solving Real Kaggle Problems) [Data Analysis/Science Part2]Course Thumbnail](https://cdn.inflearn.com/public/courses/327464/cover/55c4db7b-7764-43cc-ac75-d9e8d08098f1/327464-eng.png?w=420)
![Complete Mastery of Big Data Analysis Certification Practical Exam Past Questions [Includes all previous sessions · Continuous updates · Dedicated practice environment provided]Course Thumbnail](https://cdn.inflearn.com/public/files/courses/342117/cover/01krvz68s4a416j2pjefmyvrff?w=420)