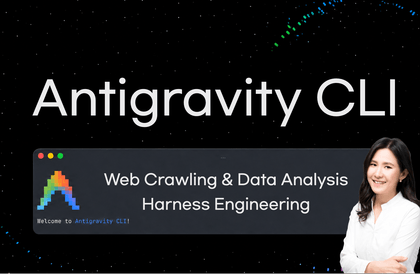
inflearn logo
inflearn logo

Getting started with Python data analysis using public data

There was a rumor that Ediya would open a store near Starbucks. How different would the locations of Ediya and Starbucks be? Will the real estate price fluctuation trend from 2013 to 2019 be reflected in the apartment sales price? What kind of parks are there in my neighborhood? How can I utilize the data in the public data portal? The goal is to become familiar with Python and various data analysis libraries by handling various types of data through public data.

(4.9) 수강평 339개

강의소개.상단개요.수강생.short

난이도 초급

수강기한 무제한

Python
Python
Pandas
Pandas
Numpy
Numpy
Python
Python
Pandas
Pandas
Numpy
Numpy

먼저 경험한 수강생들의 후기

먼저 경험한 수강생들의 후기

4.9

5.0

마낙또

20% 수강 후 작성

I am a student who is taking on a new challenge at a fairly young age. I used to do similar data analysis at my previous company, but if there were such convenient and good tools, I would have been able to increase productivity at my company. Through the instructor's lecture, I was able to learn that data analysis can be done easily, broadly, and deeply through Python notebooks. I am so grateful that it gave me a new perspective on approaching data. The lecture is so easy to understand and informative that I would like to recommend it to others.

5.0

hsw400

36% 수강 후 작성

I am studying in the US. It is more informative than the lectures by famous professors at school.

5.0

Jang Daehyuk

24% 수강 후 작성

I think this is the best lecture in terms of data analysis (loading, preprocessing, EDA, visualization). While studying Python data analysis methods and coding examples, I think, "What can I do with this?" I think this lecture provides answers and clues to that. Also, many of the methods used in parts are very useful. In addition, it was very good that it was renewed by supplementing recent data and explanations. Conclusion: If you want pandas, seaborn, matplotlib + @, just listen. If you are a beginner, you will never regret it.

강의상세_배울수있는것_타이틀

  • Data Analysis and Visualization with Python

  • Practice using public data

  • Data preprocessing and statistical analysis

  • Map visualization and text data processing


I have collected valuable feedback from running the course for a year.
In 2020, "Getting Started with Python Data Analysis with Public Data" has been completely revamped!

✍🏻 I rewrote both the code and the video .

• A wider variety of graphs (heat maps, histograms, distributions, scatter plots, regression graphs, etc.) than before have been covered, and content has been added to make it easier to draw subplots.

📝 We provide both practice code and result code .

Please use the practice file ( 01-apt-price-input.ipynb ) that provides a simple guide so that you can follow the code while watching the video, and the file (01-apt-price-output.ipynb) that displays the results .


Related Roadmap

Python Real-World Data Analysis for Bone Science
A data science roadmap you can use in your real-world work!
Including this lecture

강의소개.콘텐츠.추천문구

학습 대상은 누구일까요?

  • Beginners who want to learn Python

  • People interested in data analysis

  • Researchers who want to utilize public data

  • Students who want to practice by handling real data

선수 지식, 필요할까요?

  • Python Basic Grammar

강의소개.지공자소개

19,686

수강생

846

수강평

1,347

답변

4.9

강의 평점

7

강의_other

더보기

커리큘럼

전체

84개 ∙ (강의상세_런타임_시간 강의상세_런타임_분)

해당 강의에서 제공: [object Object]
강의 게시일: 
마지막 업데이트일: 

수강평

전체

339개

4.9

339개의 수강평

  • hsw4000847님의 프로필 이미지
    hsw4000847

    수강평 5

    평균 평점 5.0

    5

    36% 수강 후 작성

    I am studying in the US. It is more informative than the lectures by famous professors at school.

    • wonseok님의 프로필 이미지
      wonseok

      수강평 15

      평균 평점 4.7

      5

      100% 수강 후 작성

      Hello? This is Sebastian Junior 3rd. I have been looking for various lectures, but when it comes to learning Python preprocessing and visualization, Professor Park Jo-eun's lecture seems to be the best. I sincerely thank you for making such a great lecture! My personal wish is that you make lectures by grouping Kaggle practice by topic so that it can be applied in practice..! ㅎㅎㅎ Thank you again!

      • chadeng842490님의 프로필 이미지
        chadeng842490

        수강평 6

        평균 평점 5.0

        5

        98% 수강 후 작성

        Hello This lecture is a really good lecture that gave me a rough idea of Python. This lecture may not cover 100%, but it taught me the basics so that I could search and find things through this lecture. Thank you so much. It's the best.

        • mudcook1083님의 프로필 이미지
          mudcook1083

          수강평 1

          평균 평점 5.0

          5

          20% 수강 후 작성

          I am a student who is taking on a new challenge at a fairly young age. I used to do similar data analysis at my previous company, but if there were such convenient and good tools, I would have been able to increase productivity at my company. Through the instructor's lecture, I was able to learn that data analysis can be done easily, broadly, and deeply through Python notebooks. I am so grateful that it gave me a new perspective on approaching data. The lecture is so easy to understand and informative that I would like to recommend it to others.

          • daehynk3548님의 프로필 이미지
            daehynk3548

            수강평 8

            평균 평점 5.0

            5

            24% 수강 후 작성

            I think this is the best lecture in terms of data analysis (loading, preprocessing, EDA, visualization). While studying Python data analysis methods and coding examples, I think, "What can I do with this?" I think this lecture provides answers and clues to that. Also, many of the methods used in parts are very useful. In addition, it was very good that it was renewed by supplementing recent data and explanations. Conclusion: If you want pandas, seaborn, matplotlib + @, just listen. If you are a beginner, you will never regret it.

            • todaycode
              지식공유자

              Thank you for your thoughtful review! Thanks to you, it has been a great help in updating all the courses up to Chapter 5. In particular, Chapter 5 has added content on analyzing and visualizing text data, such as extracting frequency from existing structured data, and implementing information masking for personal information protection using regular expressions using email, phone number, and car registration number. We will continue to update the content through feedback in the future :)

          todaycode님의 다른 강의

          지식공유자님의 다른 강의를 만나보세요!

          비슷한 강의

          같은 분야의 다른 강의를 만나보세요!

          강의상세.할인문구

          $5,721.00

          29%

          $51.70