Mastering data analysis and visualization with just two pages of documentation
When using Pandas for data analysis, preprocessing, machine learning, and deep learning, we often find ourselves relying on the same core functions.
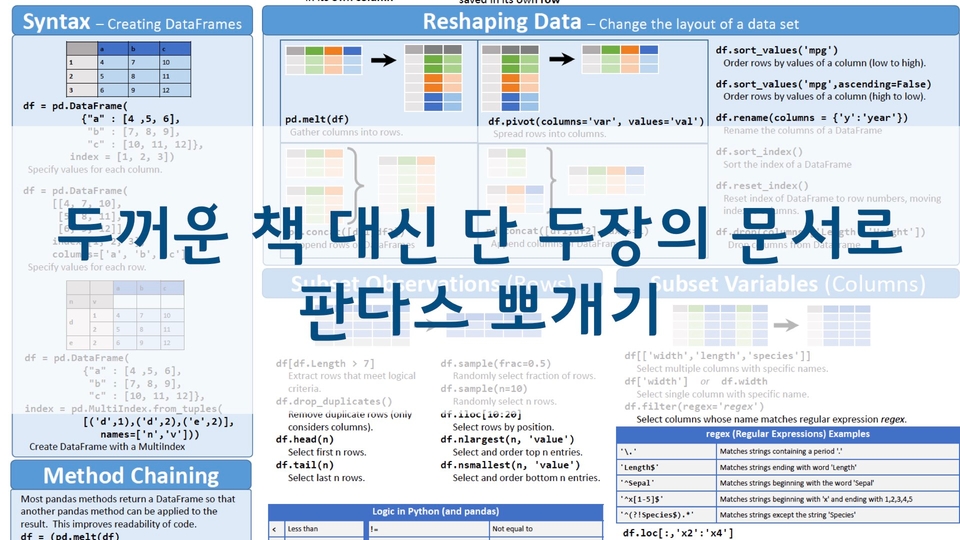
There is a Pandas Cheat Sheet that compiles only these essential features. For those who have grown tired of trying to learn Pandas through thick books, this two-page document will teach you Python Pandas. Master the core functions of Pandas using the cheat sheet provided by the official Pandas tutorial.
I want to make your analysis method mine. Thank you.
5.0
세바스찬 주니어 3세
89% enrolled
As a beginner, I think this is a great lecture that will help you learn the overall concept of Pandas and learn thoroughly how to use it for actual analysis. I have taken several lectures on Pandas, but I think this is the only lecture that explains the details one by one with such quality. I will review it again and apply it to actual business data and analyze it. Thank you so much for making such a great lecture!!
5.0
pooh9431
37% enrolled
It's a good curriculum. Even a beginner like me could see the operating principles and results at the same time. What I like the most is the Q&A part. If there's something you don't know, you can ask the teacher questions and get answers right away. And the teacher's voice has such a good wavelength that it's easy to concentrate.
What you will gain after the course
Key features from the Pandas Cheat Sheet
Python Data Analysis
Data preprocessing for machine learning and deep learning
Data Visualization
Crawling, Preprocessing, Analyzing, and Visualizing the Seoul COVID-19 Site with Pandas
Python Pandas Data Analysis, all the essentials at once!
With just two pages of documents, can you really master Pandas data analysis?
Pandas is a library that allows you to use Excel-like functions in Python.
Large-scale data processing that Excel can't handle is also OK.
Pandas is a Python data analysis library for data analysis and preprocessing.
When performing data analysis, preprocessing, or visualization with Python Pandas, you tend to use certain core functions most of the time. And there is a cheat sheet that summarizes these essential functions in just two pages.
However, if you try to study a cheat sheet containing only these core concepts on your own, you might feel overwhelmed about what content to practice and how to do it. In this course, we will extract and explain only the core content of the cheat sheet and guide you on how to easily use the complex Matplotlib through Pandas. Shall we take on the challenge together?
Who is this for?
Those who want to perform preprocessing required for data analysis and ML/DL
Those who have been flustered when a large data file wouldn't open in Excel
Those who are tired of complex formulas while analyzing data using Excel
Those who have implemented various formulas in Excel but had to work overtime due to slow speeds
📣 Please check the prerequisite knowledge!
Python, Jupyter Notebook, Anaconda, and the concept of rows/columns in Excel are required as prerequisite knowledge.
Focusing on official documentation, easily, quickly, and accurately.
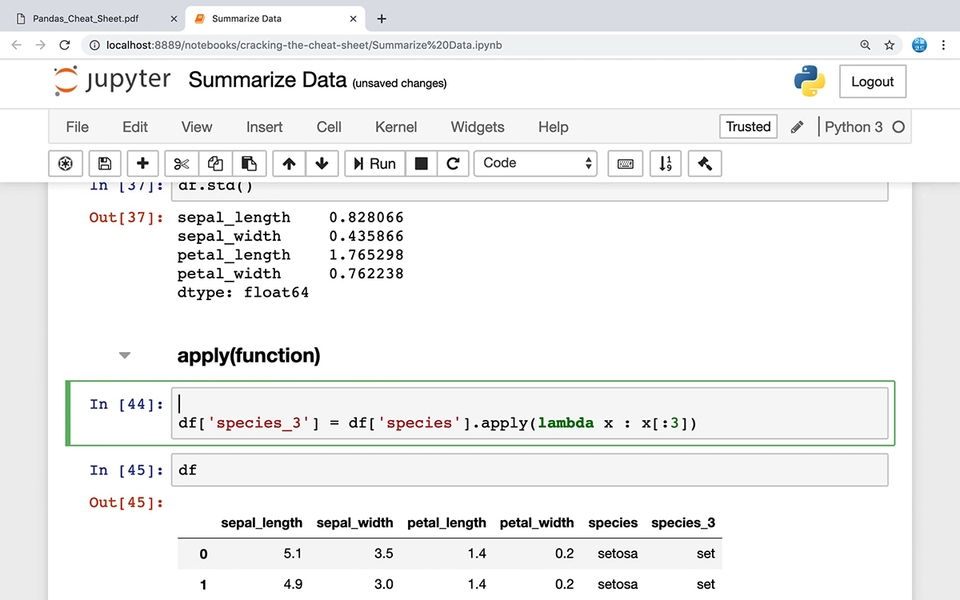
One, utilizing docstrings in Jupyter Notebook
You don't need to memorize many methods. The functions actually used are limited. In this course, I will show you how to practice by looking up official documentation within Jupyter Notebook so that you can learn on your own by referring to help menus and documents.
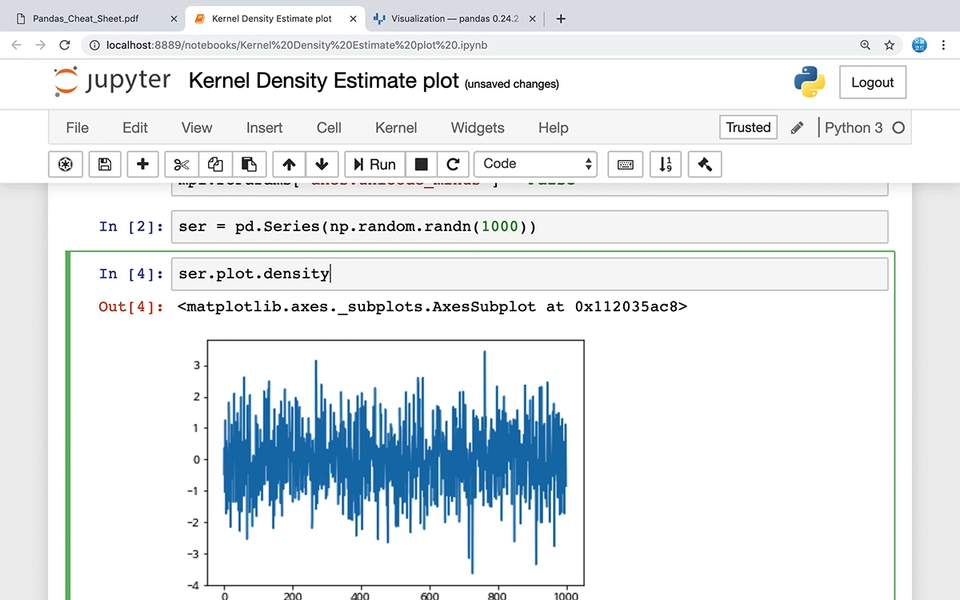
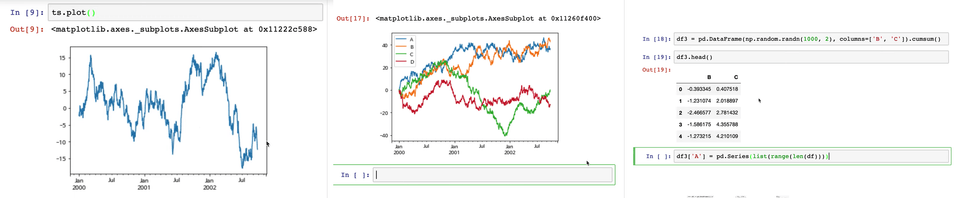
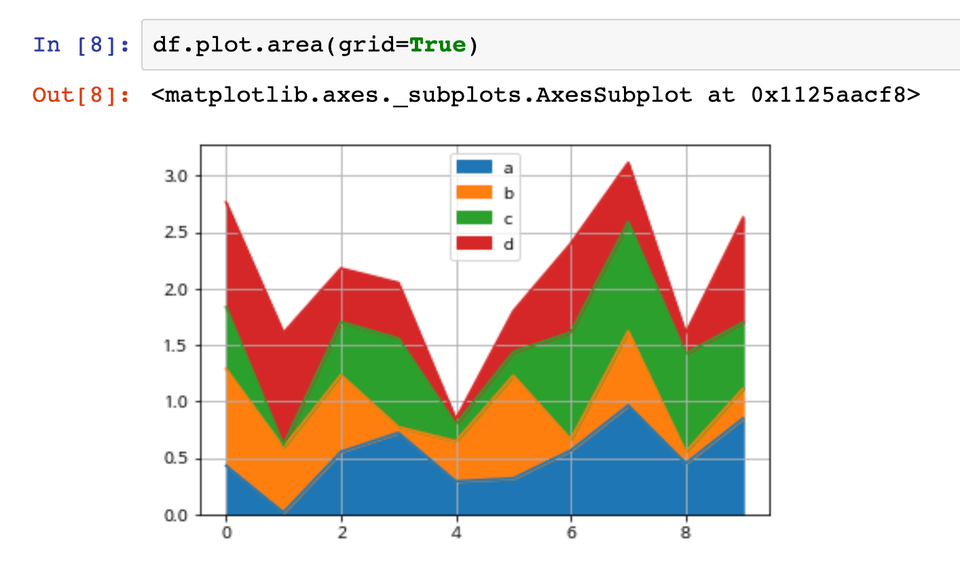
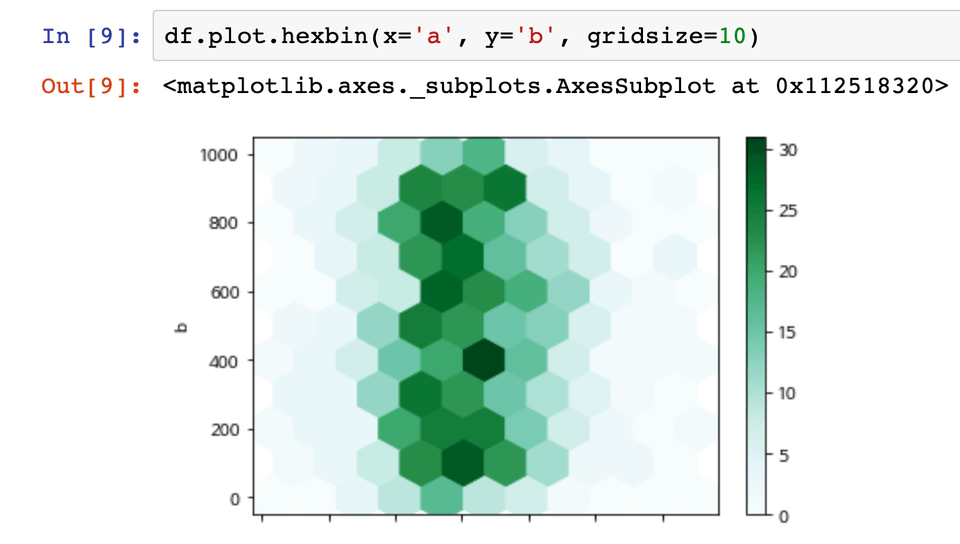
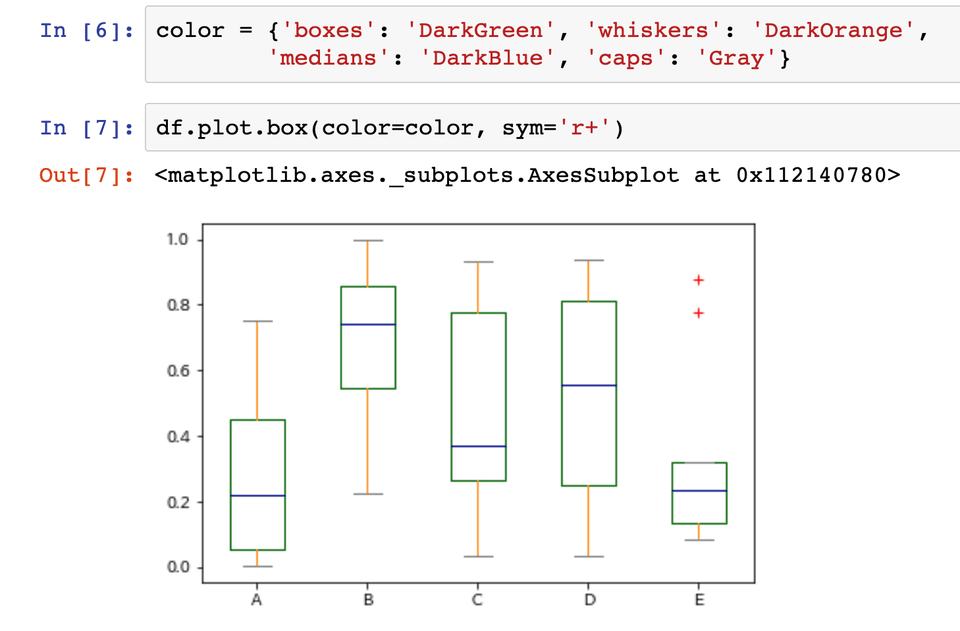
Two, how to do Pandas data visualization twice as well!
Do you know which graphs are appropriate for which types of data? In this course, we examine the differences and usage of bar charts, frequency distribution tables, histograms, and normal distributions. Furthermore, we explain various Python visualization methods and how to use options through the official Pandas documentation.
Bonus, including Series and DataFrame data visualization!
Additional Update! Real-world data analysis projects.
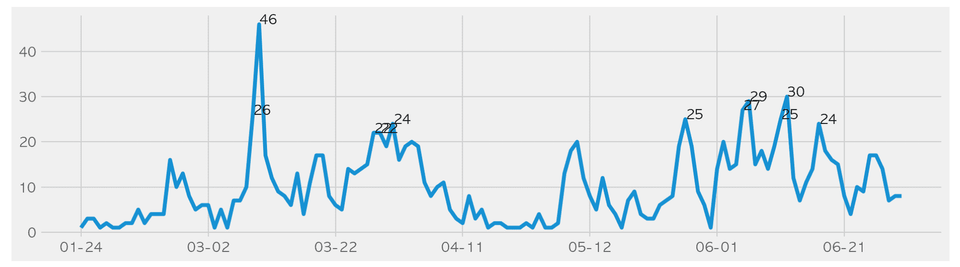
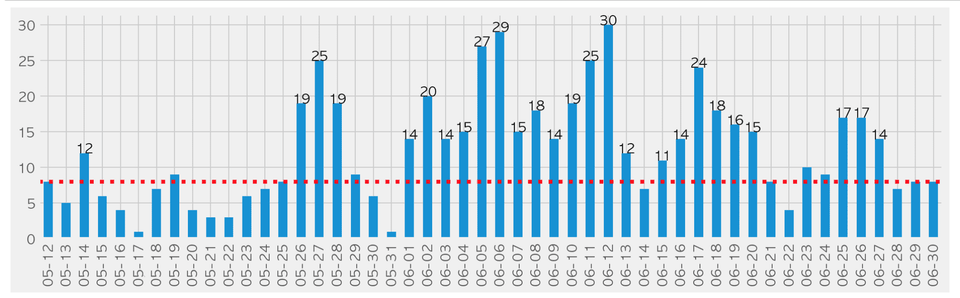
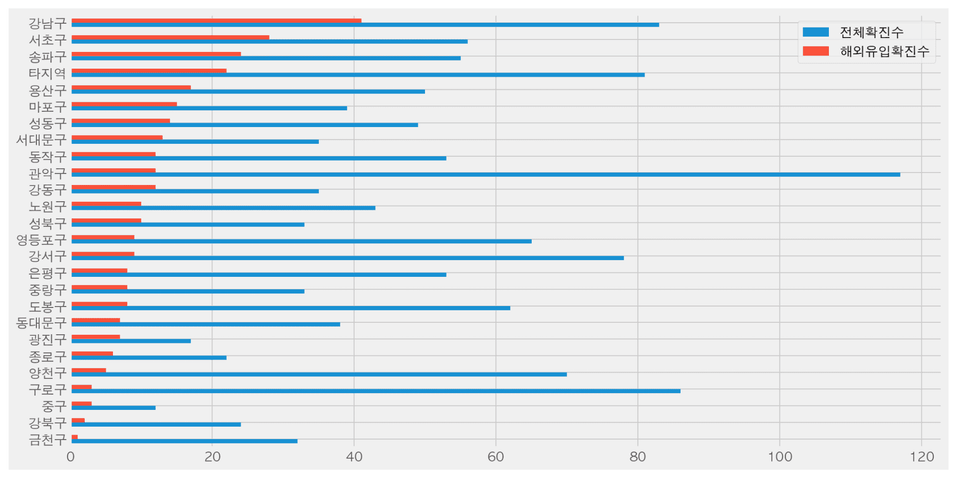
We will analyze the Seoul COVID-19 status website using Pandas, covering everything from data crawling to preprocessing, analysis, and visualization. You can apply what you've learned from just two pages of documentation to a project similar to real-world tasks. (Section 13)
First, we will directly analyze data that we frequently encounter in our daily lives through the news.
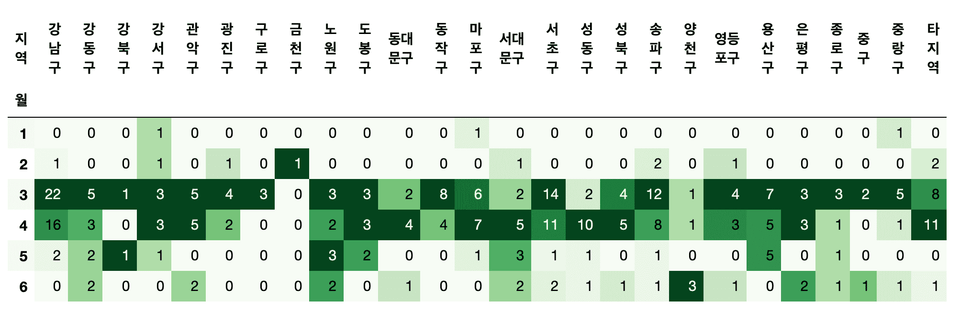
Which district had the highest number of confirmed cases?
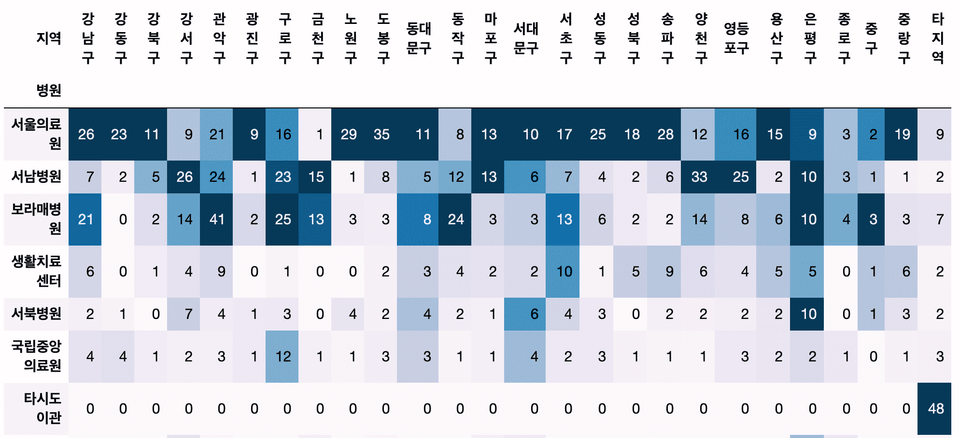
Which hospital treated the most confirmed cases?
Are there specific hospitals that receive a high number of transfers from each district?
Which district had the highest number of confirmed cases from overseas?
How can we perform text preprocessing to group various countries into regions like Europe or South America?
What are the monthly differences in the number of confirmed cases from overseas inflows?
Second, understand and practice data preprocessing methods using Pandas.
How can we extract the year, month, day, day of the week, and week from a date in text format?
How can we calculate the cumulative number of confirmed cases using the status data?
What are the differences between groupby, crosstab, pivot, and pivot_table, and which function is most suitable to use?
Third, understand the data structures of DataFrames and Series, and process them into a format suitable for analysis.
What should the structure of a DataFrame look like to draw a graph using Pandas' plot?
If you want to represent values in different colors based on categorical values in a graph, how should you modify the dataframe?
What are the different ways to convert a Series into a DataFrame?
Python visualization & analysis examples, check them out directly in the lecture!
Curious about the knowledge sharer who created this course? 👩💻
Instructor Jo-eun Park X Inflearn Interview
Recommended for these people
Who is this course right for?
Those who want to perform preprocessing for data analysis, machine learning, and deep learning using Python.
Those who have been flustered when a file failed to load while trying to open a large amount of data in Excel.
Those who are tired of complex Excel formulas
Those who had to work overtime because Excel was slow despite implementing various formulas.
Instructor and Curriculum Designer for Data Science at Naver Connect Foundation Boostcourse
Seoul National University Big Data Innovation Sharing University, Seoul National University Continuing Education Center, Yonsei University DX Academy, Hanshin University ABC Camp, Hanyang University Graduate School, Chonnam National University,
Lectured at numerous educational institutions and corporations, including Korea Management Association (KMA), IGM Institute for Global Management, Samsung SDS Multicampus, LIKE LION, Fast Campus, Modulabs, and National Cancer Center.
Corporate data analysis across various domains (pharmaceuticals, telecommunications, automotive, commerce, education, government agencies, etc.)
Over 20 years of professional experience as a web backend developer and data analyst across various domains, including gaming, advertising, and education.
It's a good curriculum. Even a beginner like me could see the operating principles and results at the same time. What I like the most is the Q&A part. If there's something you don't know, you can ask the teacher questions and get answers right away. And the teacher's voice has such a good wavelength that it's easy to concentrate.
As a beginner, I think this is a great lecture that will help you learn the overall concept of Pandas and learn thoroughly how to use it for actual analysis. I have taken several lectures on Pandas, but I think this is the only lecture that explains the details one by one with such quality. I will review it again and apply it to actual business data and analyze it. Thank you so much for making such a great lecture!!
I was surprised that there were only good reviews.
Personally, I didn't like the lecture because I thought the code explanation was lacking and it was ambiguous.
What was ambiguous was that even though the lecturer was a Pandas expert, he didn't feel like he was fiddling with the data at all,
and just brought in a very simple cheat sheet,
and explained it in more detail and applied it like this or like this or how it is actually used a lot,
and didn't give any additional explanations on why this code works like this,
and just explained the cheat sheet to the extent of a short period of time and finished.
There was no additional explanation at all for things that were considered essential.
I seriously watched the whole lecture even though I knew the content of the lecture.
But from a beginner's perspective, there were parts that made me wonder, "What exactly is that function?? Is it used a lot???"
and that was frustrating because it was like that throughout the entire lecture.
It's a lecture where they just bring in the code and roughly explain it to that extent.
Hello. I'm sorry that it wasn't of much help since you already knew all the content here.
This course is for those who are new to Pandas, and it focuses on learning the functions with two cheat sheets rather than a thick book, so you probably didn't feel like you were touching the data.
The reason I created this course is because I recommended cheat sheets to beginners, but I received a lot of feedback saying that they didn't know how to use them.
As you said, it mainly focuses on the functional part. The process of analyzing actual data is covered in other courses, so this course doesn't cover it.
So you might have felt that there was a lack of information on what is important and what is mainly used.
This course is also planning to revise some of the content to match the updated Pandas version, and I will reflect your feedback when revising it.
The Seoul City Corona data analysis has been added to the lecture. We have supplemented the parts that we thought were lacking based on the feedback you left. We will analyze the differences between similar methods and why the method is used by bringing in actual publicly available data. We will continue to update this lecture in the future.
Overall, it was a good course. I studied Pandas on my own with a book and applied for this course for the purpose of repeated learning and application of Pandas.
The Pandas cheat sheet course was actually not that great. It won't be of much help to those who are new to Pandas, new to Python, or very beginners. It's okay as a YouTube video, but it's a bit disappointing as a paid lecture.
The Seoul City Corona Analysis course was good. It was a very useful part for me who studied the basics of Pandas because I was able to practice how to process data by applying Pandas to obtain the desired form and results.
And the tips given here and there were also very helpful. Like shift-tab, or using ? after a function to see the dot string... I think these are great tips...
Summary in one line: I don't recommend it to those who are just starting out with Pandas, but I highly recommend it to those who know a little about Pandas.


![Complete Mastery of Big Data Analysis Certification Practical Exam Past Questions [Includes all previous sessions · Continuous updates · Dedicated practice environment provided]Course Thumbnail](https://cdn.inflearn.com/public/files/courses/342117/cover/01krvz68s4a416j2pjefmyvrff?w=420)
![[Renewal] First-time SQL and Database (MySQL) Bootcamp [From Beginner to Application]Course Thumbnail](https://cdn.inflearn.com/public/courses/324208/cover/85872a8e-d2bb-4c43-82fc-d55fa067746e/324208.png?w=420)