inflearn logo

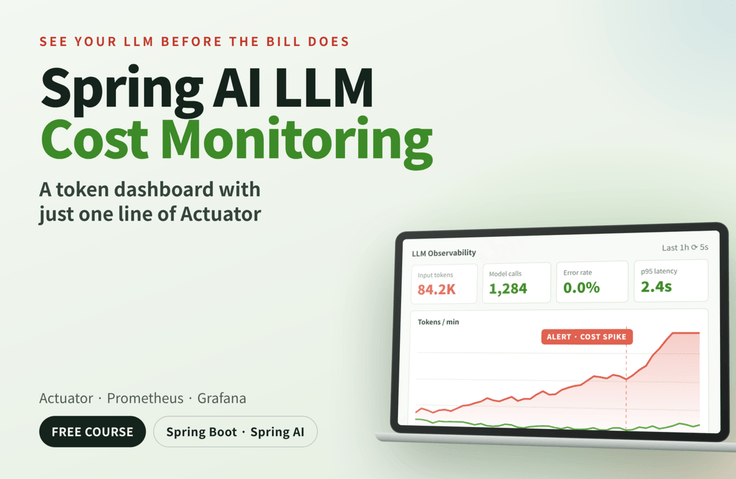
Spring AI LLM Cost Monitoring — A Token Dashboard in One Line with Actuator

Learn how to see in numbers and graphs how many tokens your Spring AI chatbot and RAG service uses, how slow it is, and how often it fails. Using just Actuator, which Spring developers are familiar with, you’ll extract the metrics Spring AI is already recording and build dashboards with Prometheus + Grafana.

108 learners are taking this course

Level Basic

Course period Unlimited

Spring AI
Spring AI
Prometheus
Prometheus
grafana
grafana
spring-boot-actuator
AI
AI
Spring AI
Spring AI
Prometheus
Prometheus
grafana
grafana
spring-boot-actuator
AI
AI
Thumbnail

What you will gain after the course

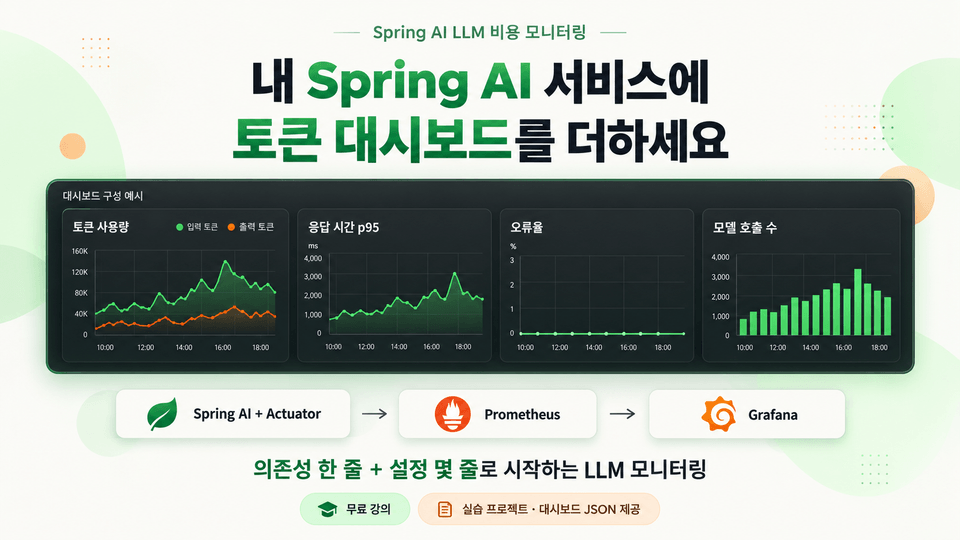
  • Learn how to view the token usage, response time, and error rate of an LLM service built with Spring AI on a real-time dashboard.

  • Enable and read the metrics that Spring AI automatically records with Spring Boot Actuator.

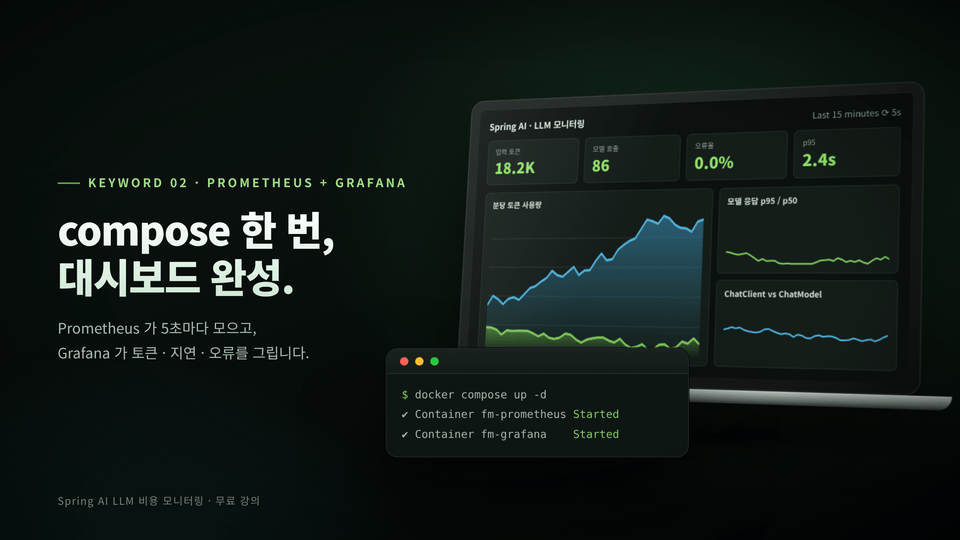
  • Collect metrics with Prometheus and complete token, latency, and error dashboards with Grafana.

  • We directly reproduce and capture on the dashboard the cost-bomb scenario where a single RAG setting multiplies costs several times over.

"We built a chatbot, but how do we operate it?" 🤔

While consulting on recent enterprise AI projects, I repeatedly received the same questions: "We built a chatbot, but how do we operate it?" "We don’t know how much it will cost." LLM services have different costs for each request, responses can take several seconds, and the causes of failures lie outside our code. Yet many teams monitor them the same way as existing web services and only realize there is a problem after receiving the bill.

The good news is that if you're a Spring developer, you already have the answer. Spring AI was designed from the start to provide observability on top of Micrometer. This course starts with that one fact and aims to get your service's token dashboard up and running within an hour.

What problem does it solve?

📌 Cannot answer "How much does this service cost per month?" → View token usage by model and input/output in real-time graphs

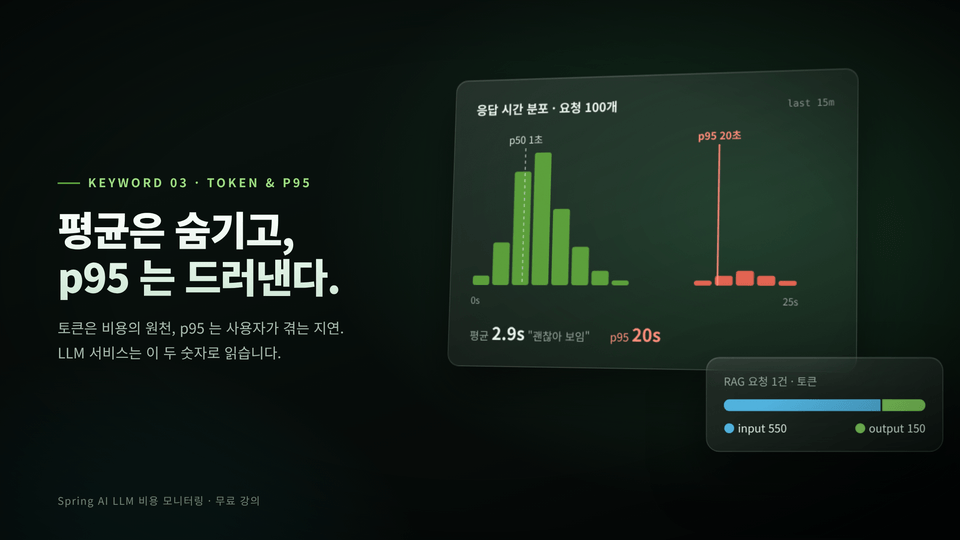
📌 They say it’s sometimes slow, but the average response time is normal → Use p95 to reveal the "slowest 5%" and break down model call time versus total app time.

📌 I changed one setting and the bill increased → Reproduce firsthand how a single topK change causes input tokens to jump by about 4x, and catch it on the dashboard.

📌 It seems like adding monitoring would require a lot of code changes → One dependency line and a few configuration lines — business code stays as is

Spring AI LLM Cost Monitoring

  1. The "one-line Actuator" strategy — No need to learn a new tool or SDK. Taking advantage of the fact that Spring AI is built on top of Micrometer Observation, we finish the job with the Actuator you already know.

  2. Cost explosion reproduction scenario — We will directly trigger a “failure that looks normal,” where there are zero errors, Health is UP, and HTTP 200 responses, yet the cost multiplies several times. You’ll remember it as a real scenario, not just theory.

  3. A complete, ready-to-use kit — We provide the hands-on project, docker-compose, Grafana dashboard JSON, and load scripts (bash and PowerShell). Because the metric names follow Spring AI standards, you can attach the dashboard directly to your project.

  4. Based on actual metric names — We tell you the names verified in the hands-on environment for areas where the documentation and actual output differ (such as ChatClient metric names). This helps prevent issues like “I followed the instructions, but the graph is empty.”

Recommended for those who…

Backend developers preparing to launch a Spring AI service

If the PoC is complete and the launch is approaching, but you still don’t have an answer to the question, "What operational metrics should we look at?"

Actuator · Prometheus는 써 봤지만 LLM은 처음인 Spring 개발자
If you’ve monitored Spring Boot·Spring Cloud services but are unfamiliar with LLM-specific metrics such as tokens, p95, and the number of model calls.

Team leads and architects who need to explain LLM costs in numbers
If you want to show “How much does it cost per month?” and “Why is it slow?” on a dashboard rather than by intuition.

After completing the course,

What you will understand

  • What each of the metrics left by Spring AI (gen_ai.client.operation, gen_ai.client.token.usage, db.vector.client.operation, spring.ai.chat.client) measures individually. What each one measures

  • How Micrometer names are converted to Prometheus names, and how to break down the data using tags

  • Why you should look at p95 instead of the average, and why “2 model calls per request” occurs

What you will be able to do

  • Expose metrics in my Spring AI project with one dependency line and a few configuration lines.

  • Use Docker Compose to launch Prometheus and Grafana, and connect the provided dashboard directly to your service.

  • Quantitatively compare the impact of configuration changes such as RAG topK and prompt length on token usage.


This is how it changes

Before taking the course

After taking the course

"How much does it cost per month?" → "Well, I won't know until the bill comes..."

"Since the current input tokens per minute are at this level, converting that based on the model's unit price comes to about this much."

"They say it's sometimes slow" → Average response time is normal, so the cause is unknown

Check the gap between p50 and p95 to immediately confirm that “only some requests have slowed down”

If everything looks fine after changing the settings, you're done

First compare the token graphs before and after the change to check the cost impact

Where is it used?

It is used in the operational preparation phase for all services that call LLM APIs such as OpenAI from a Spring Boot backend, including in-house knowledge search chatbots, customer support bots, and document summarization and RAG services. It can be used directly for cost forecasting before launch, cost and performance monitoring after launch, and metrics for executive reporting.

  • Enable and read the metrics that Spring AI automatically records using Spring Boot Actuator.

  • Collect metrics with Prometheus and complete dashboards for tokens, latency, and errors with Grafana.

  • With a single RAG configuration, you will recreate firsthand the cost explosion scenario where expenses multiply several times and catch it on the dashboard.

  • You can identify items that are difficult to find on average through p95.

The person who created this course

With the belief that “knowledge in your head is not knowledge,” I strive to package the small amount of experience and knowledge I have and explain it in a way that is easier to understand. Based on Java and the Spring Framework, I believe this course will be easier to understand for those who are also interested in the fields of LLM and AI.

  • Based on 26 years of experience in teaching, consulting, and development, I conduct lectures with explanations designed to help you understand practical experience and know-how.

  • Current work as an architect and engineer: I am directly designing and developing GraphRAG-based knowledge graph systems and enterprise AI platforms.

    • 2023 ~ Present: CEO of NJ One Company Co., Ltd.


    • Current) Adjunct Professor, Department of Information Security, Graduate School of International Information Studies, Dongguk University

    • Former) JP Morgan Chase AMJ Tech consultant (Japan)

    • Formerly Samsung SDS CMS Business Division, Principal Engineer

  • Financial-sector AI/LLM project execution: By repeatedly carrying out AI·LLM-related projects in the financial sector, I gained hands-on experience designing and implementing LLM services in the financial domain, where reliability and stability are especially important.

  • Years of teaching MSA, cloud-native technologies, and AI: I teach courses in Spring Boot, Spring Cloud, MSA, Kafka, Blockchain, Machine Learning, Deep Learning, and DevOps.

  • Corporate training and curriculum design: I have designed curricula for and personally taught numerous corporate and bootcamp courses in cloud, MSA, security, and AI, with a guiding principle of incorporating real-world project experience into my lectures rather than stopping at theory.

Notes Before Taking the Course

Practice environment

  • OS: macOS · Windows · Linux (A separate PowerShell script is provided for Windows)

  • Required: JDK 21 or later, Docker Desktop (Docker Compose v2)

  • Recommended IDE: IntelliJ IDEA (use the HTTP Client to execute practice requests)

  • LLM: OpenAI API key or Ollama (free)

  • Reference versions: Spring Boot 3.5 · Spring AI 1.0.x

Learning Materials

  • Practice project free-llm-monitoring (compressed file, GitHub repository shared)

  • docker-compose, Prometheus configuration, Grafana dashboard JSON

  • Practice request collection (.http), load scripts (bash · PowerShell)

  • Course materials (step-by-step commands · expected results · troubleshooting guide when you get stuck)

Prerequisites and Notes

  • Required: Experience creating REST APIs with Spring Boot and familiarity with basic terminal commands

  • Nice to have: Basic Docker usage skills

  • Not required: Prior knowledge of Prometheus, Grafana, or Spring AI

Notes

  • Using OpenAI incurs API usage fees (a small amount for the entire exercise). To avoid costs, use Ollama.

  • When running Ollama on a CPU, responses may take anywhere from a few seconds to several tens of seconds. The graph values will differ from OpenAI, but the hands-on practice flow is the same.

  • Metric names may vary depending on the Spring AI version. The course also explains how to check the actual names.

Recommended for
these people

Who is this course right for?

  • Backend developer preparing to launch the Spring AI service

  • Actuator · A Spring developer who has used Prometheus but is new to LLMs

  • Team leaders and architects who need to explain LLM costs with numbers

Need to know before starting?

  • Experience creating REST APIs with Spring Boot

  • Basic Terminal Commands

  • Basic Docker Usage

Hello
This is Dowon Lee

Inflearn Verified

32,255

Learners

1,787

Reviews

1,394

Answers

4.8

Rating

11

Courses

I am an IT engineer. There was a time when I wondered which word I should choose for the occupation field: "office worker?", "developer?", or "instructor?" Then I came to think that “IT engineer” was the job title that suited me best, so I have continued to write "IT engineer" in the occupation field.

A profession represents the work you do, and I believe that work should be enjoyable and useful. Although no one can live by doing exactly the work they want, I am someone who likes the work I do and wants to do it well. Having worked as a developer, instructor, and consultant, I am constantly struggling to keep up with newly released and ever-changing IT technologies. Even so, I am one of those people who wants to encounter, share, and use them even a little earlier than others.

The field I have recently become interested in is online education consulting. The technologies I am interested in include Cloud Native Architecture, Blockchain, Machine Learning, Kafka, and Kuberbetes. I actually teach courses on these technologies and apply them in my work as well. However, since they are such vast topics, I am still continuously studying them.

They say that what you keep in your head is not true knowledge. I intend to share my knowledge and experience in various ways. And I will continue to be an IT engineer who takes on new challenges in new fields and with new technologies.


  • Current) CEO of NJ One Company

  • Current) Adjunct Professor, Department of Information Security, Graduate School of International Information, Dongguk University

  • Former) JP Morgan Chase AMJ Tech consultant (Japan)

  • Former) Samsung SDS CMS Business Division Lead Engineer



More

Curriculum

All

11 lectures ∙ (1hr 12min)

Published: 
Last updated: 

Reviews

Not enough reviews.
Please write a valuable review that helps everyone!

Dowon Lee's other courses

Check out other courses by the instructor!

Similar courses

Explore other courses in the same field!

Free