QGIS Map Visualization A to Z (Vector/Basics Edition)
A QGIS course for hands-on learning of diverse map visualization and layout features using QGIS.
Get real-world skills via 7 practical thematic map creation examples!!
After taking the QGIS Beginner All-in-One Starter Pack (Theory/Practical), I liked it so much that I decided to enroll in this course as well.
Compared to the All-in-One course, there is some overlap in the background knowledge needed for the course (GIS concepts) and basic vector data handling (layer joins). However, it was useful to be able to learn new content by going deeper into vector visualization. Additionally, learning the layout function using composition was the second biggest takeaway.
So even though there was some overlap with the All-in-One content, it made sense as background knowledge for people taking only this course, and the new content specific to this course - advanced vector visualization and layout composition functions - was useful.
The teaching method doesn't just stop at explaining concepts, but includes hands-on practice throughout and ends with practical examples, spending plenty of time to ensure I could fully understand and make it my own.
5.0
hoo0chan
98% enrolled
I'm studying for the first time, but thank you for teaching me in detail. I will continue to review and try to grow the pie.
5.0
트레비
70% enrolled
Thank you for even explaining the typeset features!!
What you will gain after the course
QGIS Visualization
QGIS Layout
Creation of Actual Thematic Maps Using Public Data
Learn QGIS visualization with 7 thematic maps 🗺️
Let me briefly introduce the QGIS visualization lecture. #QGIS #GIS #data-analysis #data-visualization #spatial-data #mapping #GIS lecture #GIS education
Let's visualize our own thematic maps using QGIS, a free open source GIS software, and public data!
What maps did you see today?
A restaurant map to find good restaurants? A navigation system to find directions? A travel recommendation map to search for travel destinations?
From the world map stuck on the wall of our childhood room to the various maps we have in our hands today, maps of all kinds are closely related to our lives.
In this day and age where information is overflowing like a flood, Now it's time to create our own map . This lecture will teach you how to do it💡
This is how the QGIS visualization course is structured
Starting with a simple introduction to GIS and lectures,
✅ Section 1. QGIS Visualization Method Practice
✅ Section 2. QGIS Layout (Layout) Usage Practice
✅ Section 3. Practical examples of creating 7 thematic maps
The lecture was structured into three sessions .
We set clear and concise goals for each session and work together to achieve them .
Let's draw a thematic map together
We first learn the basics of QGIS visualization in Section 1 . Using public data in vector format Set the size, color, shape, labeling, etc. that you want. Practice visualization methods .
And, through Section 2 , we will learn about some useful visualization features of QGIS. Learn layout . In layout, I create maps. Create a completed typesetting by adding a title, scale, orientation, legend, image, etc. You can even learn how to save it as a template .
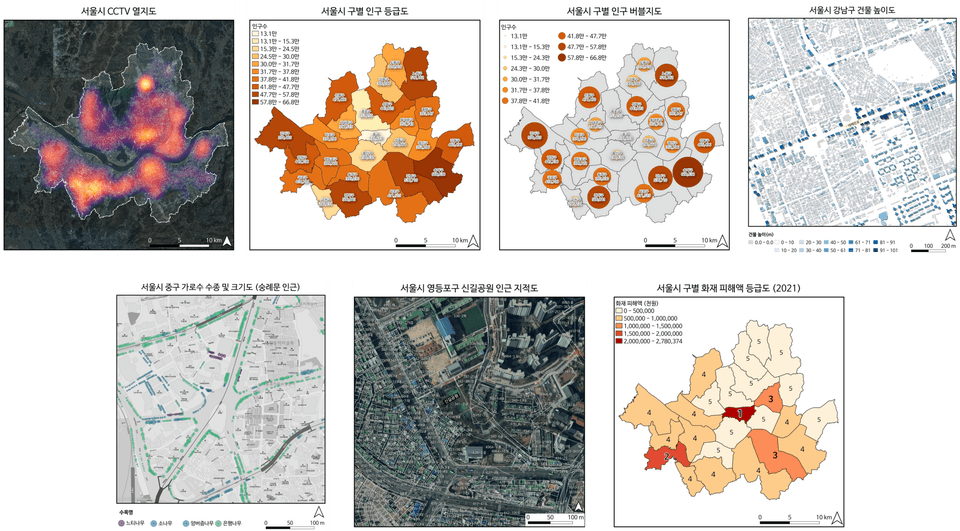
Section 3 Practical Example uses Seoul City public data. Let's draw the following seven thematic diagrams .
Seoul City CCTV Distribution Heat Map
Seoul City District Population Rating Chart
Seoul City District Population Bubble Map
Height chart of buildings in Gangnam-gu, Seoul
Map of street trees in Jung-gu, Seoul and their sizes
Land map of the area around Singil Park in Yeongdeungpo-gu, Seoul
Seoul City Fire Damage Rating Chart by District (2021)
Each thematic map is designed to leverage everything you've learned about QGIS visualization and layout .
Once you've completed all the practical examples, you'll be able to create your own maps!
All materials and subject templates used in the lecture are provided in one place, organized in an easy-to-view manner. We provide an environment where you can skip complex data downloads and focus on the lecture .
I recommend this to these people!
✅ Students learning GIS
Map visualization is one of the fundamental functions of GIS. If you are a student currently learning GIS, By learning visualization methods, you will become more familiar with GIS and its features more quickly .
✅ Researchers who need map visualization
Researchers who utilize professional data, You need to visualize your results in a nice map. By creating a thematic map using various Seoul City public data, You will gain experience creating maps with your data .
✅ Professionals who use GIS in actual work
Thematic maps created with GIS are used in plans, reports, and reporting materials. It is used in numerous tasks . The ability to create great maps will enhance your work skills, We will help you become an indispensable and competent person one step faster.
Q&A💬
Q. Is it okay if I don't have any experience using QGIS?
This course focuses on QGIS visualization, so it lacks much of the explanation of QGIS analysis functions and basic concepts and applications. However, if you are focusing on visualization, you can take this course without any prior knowledge of these functions.
You don't have to worry because we will explain the basic functions required for visualization, such as installing QGIS, adding layers of files you want to visualize, joining tables, and rewriting fields. 😊
Q. Will I be able to draw the map I have imagined (or seen)?
I think that there are as many maps that can be drawn as there are data in the world. This lecture focuses on visualizing public data, especially vector data, so if the map is based on raster data, the content of this lecture alone may be insufficient.
However, since it covers most of the visualization methods for vector data and includes explanations on typesetting, I expect that you will be able to draw the map you want if you have the available data.
Also, we are planning to open lectures on visualization of raster format data, advanced visualization, etc. in the future, so please look forward to the lectures that will come up in the future. 👍
Q. I need repetitive visualizations. Is there anything in the lecture that would be helpful?
Yes, the QGIS layout feature covered in Section 2 is very efficient for repetitive tasks. If you create a template in advance and simply change the map type/title/other elements, you can easily create a large number of maps under a unified format. 🎉
Here are some other QGIS lectures from the instructor 🔗
(Click on the image to go to the lecture page)
QGIS Trendy Visualizations to Try
QGIS Python Automation (Vector Edition) Ver.2
QGIS Beginner All-in-One Starter Pack
Check out the roadmap divided by topic and difficulty level!!
-Data Visualization that Transforms Reports- Data Utilization Competency Enhancement Training (2nd Session); Hosted by Gyeonggi-do Provincial Human Resources Development Institute; 2022.12.07. & 09.
Capacity Building Training for Water Industry Employees - Digital Program Practice (Beginner) & Q-GIS Practice (Intermediate); Hosted by K-water; 2023.06.19.-20.
QGIS Basic Special Lecture; Hosted by the Instructor; 2023.10.07-08.
WISE-UP WORKSHOP Urban Spatial Data Analysis; Hosted by SNU Graduate School of Environmental Studies-BK21 Smart City Research Group; 2024.02.23.
Creating Our School Map Using Public Data (Dongbuk High School); Organized by Seoul National University Center for Continuing Education; 2024.05.11.
Creating Our School Map Using Public Data (Samsung High School, Seomun Girls' High School); Hosted by Seoul National University Institute for Continuing Education; 2024.07.08. - 10.
"2024 Water Company Employee Competency Enhancement" Training - Digital Program Practice (Basic) - Q-GIS Practice; K-water; 2024.10.02.
2024 Comprehensive Evaluation Plan for Regulated Pests - Visualization of Fire Blight Outbreaks Using QGIS; Chungnam Agricultural Research and Extension Services; 2024.10.16.
Data Analysis Expert Training Course; Korea Environment Corporation; 2024.10.25.
Data Analysis Expert Training Course; Korea Environment Corporation; 2025.04.23.
Big Data Analyst Training Course Using AI; SeSAC; 2025.07.08-16.
Understanding GIS and Spatial Analysis via DBMS & Data Visualization (Basic); Hyundai NGV; 2025.10.23-24.
Understanding GIS and Spatial Analysis & Data Visualization via DBMS (Advanced); Hyundai NGV; 2025.11.10-12.
Hello. This is UPWISE.
Thank you for choosing my lecture as your first step in QGIS visualization.
If you encounter any difficulties while performing visualization, please feel free to ask questions at any time.
And please pay attention to the various visualization lectures that will be opened in the future. Thank you 😀
UPWISE Dream
After taking the QGIS Beginner All-in-One Starter Pack (Theory/Practical), I liked it so much that I decided to enroll in this course as well.
Compared to the All-in-One course, there is some overlap in the background knowledge needed for the course (GIS concepts) and basic vector data handling (layer joins). However, it was useful to be able to learn new content by going deeper into vector visualization. Additionally, learning the layout function using composition was the second biggest takeaway.
So even though there was some overlap with the All-in-One content, it made sense as background knowledge for people taking only this course, and the new content specific to this course - advanced vector visualization and layout composition functions - was useful.
The teaching method doesn't just stop at explaining concepts, but includes hands-on practice throughout and ends with practical examples, spending plenty of time to ensure I could fully understand and make it my own.
Hello Mr. Cha Taeyoung. Thank you for taking this course following other courses, and for leaving such detailed and helpful reviews.
Also, hearing that you found this course useful gives me, as the instructor, tremendous strength more than anything else.
I will come back with useful features in the visualization course that will be renewed this year and other courses that will be released in the future. Thank you :)
Best regards, UPWISE


![[Free] A Taste of Trendy QGIS Visualization (Presidential Election Map)Course Thumbnail](https://cdn.inflearn.com/public/files/courses/337567/cover/01jwebxr77n1rygt6nq9azcn4b?w=420)