
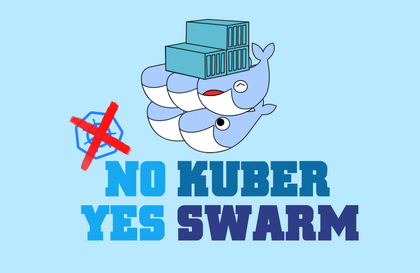
How to use Docker Swarm instead of Kubernetes - Core Lecture
backchur
The lecture focuses on how to use Docker in Swarm mode. It guides beginners to easily build and operate servers.
Basic
Docker, docker-swarm, cloud-computing
Let's create a dashboard by visualizing various data.
221 learners
Level Beginner
Course period Unlimited
Reviews from Early Learners
5.0
smathj
It seems like this was the only course on Inflearn that taught about Grafana through various different cases. Thank you so much !!!
5.0
안뇽뇽
Taught well from basics in detail, it's good. 👍🏻
5.0
야근디버프
Your slow, step-by-step explanations help me understand.
Installing Grafana and various DBs using Docker
Creating sample data for Postgres, Elasticsearch, Prometheus
Creating a dashboard visualizing data from various DBs
In this course, you will learn how to use Grafana to create dashboards that make it easy to visually understand your data .
It is useful for developers, operators, and planners as it allows real-time monitoring of the status of IT systems, servers, and web services.
Example: Numbers like CPU usage, number of server errors, number of users, etc. are displayed in graphs so you can quickly find problems .
The lectures are designed to be easy to follow .
Install Docker and Grafana.
Create a variety of visualization panels, including line graphs, pie graphs, tables, and bar graphs.
The method of creating a Panel varies depending on the DB.
Let's install the DB and create a dashboard by running a simple query on each DB.
You can specify separate Dashboards that can be accessed by teams and users, or set them to be viewable without logging in.
Set an alarm to sound when a dashboard value reaches a certain point.
Operating System and Version (OS): Windows, macOS, Linux (Ubuntu, CentOS, etc.)
Tools used: Docker, Terminal
Provides downloadable scripts used in the lecture
It's okay if you don't have experience using Docker, Grafana, PostgreSQL, Elasticsearch, or Prometheus.
It would be good to know the basics of using the terminal.
In this lecture, we will use Vim for editing scripts, but you can use an IDE tool such as VScode or Pycharm instead.
When performing various installations, please proceed with the same version specified in the lecture as possible.
Who is this course right for?
Have a DB, need visualization tool
Those who have never used Grafana and want to learn from scratch
Need to know before starting?
Basic Terminal Usage
How to use IDE tools like Vim or VS Code
Database Basic Concepts
221
Learners
16
Reviews
2
Answers
4.8
Rating
1
Course
I am an ordinary SRE.
I enjoy sharing my knowledge with others.
All
27 lectures ∙ (2hr 47min)
Course Materials:
All
16 reviews
4.8
16 reviews
Reviews 1
∙
Average Rating 5.0
Reviews 1
∙
Average Rating 5.0
Reviews 1
∙
Average Rating 5.0
5
While working as a backend developer, I use Grafana along with Kubernetes, but since there wasn't much material on Grafana, I decided to take this course! They explained everything by showing examples one by one, and it was hard to figure out what was what when I first went into Grafana, but after watching the course, I feel like I'm starting to get a sense of where to look in Grafana to see the data I want 😊😊 I think it's great for people who are new to Grafana, and also good for those who have only roughly accessed it and used familiar functions, and want to learn a bit more about Grafana!
Reviews 15
∙
Average Rating 4.8
Reviews 48
∙
Average Rating 5.0
Explore other courses in the same field!
Limited time deal ends in 3 days
$10,010.00
30%
$11.00