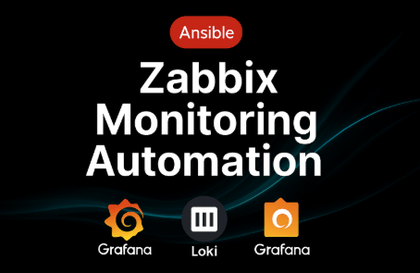
강의

멘토링

커뮤니티

Programming

/

Devops & Infra

Install Grafana and create dashboards

Let's create a dashboard by visualizing various data.

(4.7) 14 reviews

166 learners

  • kjlab
grafana
docker
PostgreSQL
Docker
Elasticsearch
Prometheus

Reviews from Early Learners

What you will gain after the course

  • Installing Grafana and various DBs using Docker

  • Creating sample data for Postgres, Elasticsearch, Prometheus

  • Creating a dashboard visualizing data from various DBs

Easy System Monitoring for Everyone – Getting Started with Grafana

Logs? Metrics? Did you find it difficult?

In this course, you will learn how to use Grafana to create dashboards that make it easy to visually understand your data .
It is useful for developers, operators, and planners as it allows real-time monitoring of the status of IT systems, servers, and web services.
Example: Numbers like CPU usage, number of server errors, number of users, etc. are displayed in graphs so you can quickly find problems .
The lectures are designed to be easy to follow .

Learn about these things

Sections (1) - (4) Creating a dashboard using various panels

Install Docker and Grafana.

Create a variety of visualization panels, including line graphs, pie graphs, tables, and bar graphs.

Sections (5) - (7) utilize various DBs.

The method of creating a Panel varies depending on the DB.

Let's install the DB and create a dashboard by running a simple query on each DB.

Section (8) Learn the features for operating Grafana.

You can specify separate Dashboards that can be accessed by teams and users, or set them to be viewable without logging in.

Set an alarm to sound when a dashboard value reaches a certain point.

Things to note before taking the class

Practice environment

  • Operating System and Version (OS): Windows, macOS, Linux (Ubuntu, CentOS, etc.)

  • Tools used: Docker, Terminal


Learning Materials

  • Provides downloadable scripts used in the lecture


Player Knowledge and Notes

  • It's okay if you don't have experience using Docker, Grafana, PostgreSQL, Elasticsearch, or Prometheus.

  • It would be good to know the basics of using the terminal.

  • In this lecture, we will use Vim for editing scripts, but you can use an IDE tool such as VScode or Pycharm instead.

  • When performing various installations, please proceed with the same version specified in the lecture as possible.

Recommended for
these people

Who is this course right for?

  • Have a DB, need visualization tool

  • Those who have never used Grafana and want to learn from scratch

Need to know before starting?

  • Basic Terminal Usage

  • How to use IDE tools like Vim or VS Code

  • Database Basic Concepts

Hello
This is

166

Learners

14

Reviews

1

Answers

4.7

Rating

1

Course

평범한 SRE 입니다.

제가 가진 지식을 다른 사람에게 공유하는 것을 좋아합니다.

Curriculum

All

27 lectures ∙ (2hr 47min)

Course Materials:

Lecture resources
Published: 
Last updated: 

Reviews

All

14 reviews

4.7

14 reviews

  • 심원경님의 프로필 이미지
    심원경

    Reviews 2

    Average Rating 4.5

    4

    33% enrolled

    • oekatcdev님의 프로필 이미지
      oekatcdev

      Reviews 1

      Average Rating 5.0

      5

      33% enrolled

      • ADK123님의 프로필 이미지
        ADK123

        Reviews 326

        Average Rating 5.0

        5

        15% enrolled

        • smathj님의 프로필 이미지
          smathj

          Reviews 35

          Average Rating 5.0

          5

          100% enrolled

          유일하게 인프런에 그라파나에 대해서 여러가지 케이스로 알려주는 강좌였던것 같습니다 정말 감사합니다 !!!

          • 박승원님의 프로필 이미지
            박승원

            Reviews 9

            Average Rating 4.4

            4

            33% enrolled

            Good

            $11.00

            Similar courses

            Explore other courses in the same field!