Get Started with Claude Code Faster Than Anyone Else | E-book
Neo
Get Started with Claude Code Faster Than Anyone Else | E-book Learn Claude Code quickly and start automating your work!
Beginner
AI, Business Productivity, Self Improvement
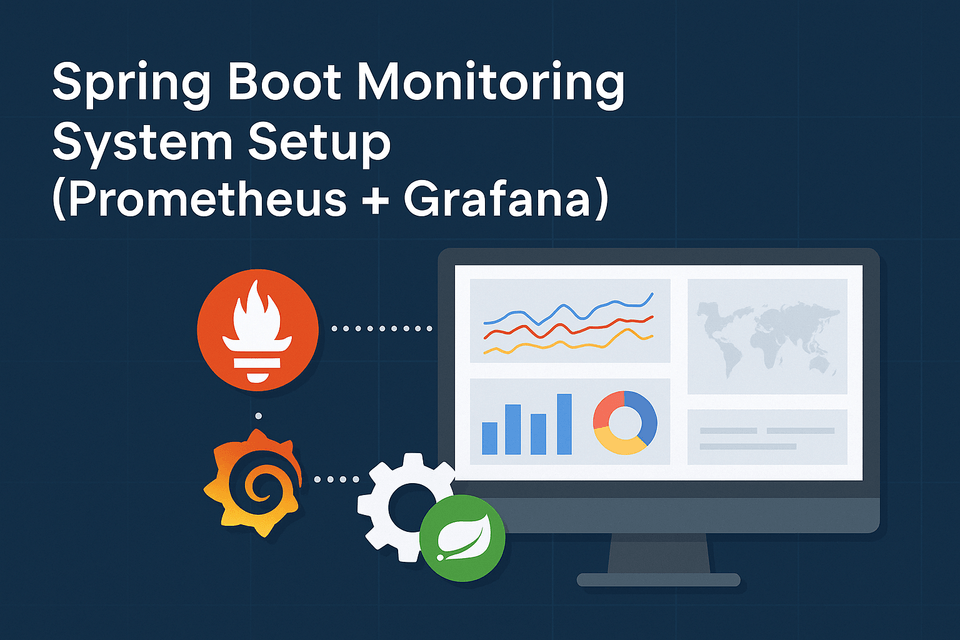
Building a Springboot Monitoring System (Prometheus + Grafana) | Teaching how to set up and utilize Building a Springboot Monitoring System (Prometheus + Grafana) from setup to application.
314 learners
Level Basic
Course period Unlimited
Reviews from Early Learners
5.0
100and
This is a course where you can build your own monitoring system in a short amount of time. Because it is concise, some advanced details are omitted, but it serves as an excellent guide for building a system first and then learning by adding necessary components later. Thanks to this, I was able to study and apply concepts that previously felt vague without any difficulty. Thank you!
5.0
codo
I've heard a lot about how important monitoring is while studying backend development, but when I actually tried to implement Prometheus or Grafana myself, I didn't know where to start. This lecture was great because it organized those vague areas in a short and clean way. In particular, even though the course isn't long, it contains all the core essentials, so I was able to finish it without feeling overwhelmed. It really helped me understand the overall flow even as a beginner. I recommend this to anyone who is new to monitoring like I am. I look forward to the next lecture.
5.0
치즈초코우유
1. I will try to create an environment where I can test locally. 2. I think this will be helpful for beginners rather than intermediate or advanced students. I hope you create intermediate and advanced courses later as well! It would be great if you could provide examples of how to handle actual deployment! Also, I think the content would be even richer if you explained how to integrate things like Loki and Promtail! There were some funny moments(?) in between, so I really enjoyed taking the course!!
Springboot Monitoring System Setup
Visualize with Grafana after collecting Prometheus metrics
Who is this course right for?
Springboot monitoring setup: Curious?
Need Springboot monitoring visualization with Grafana + Prometheus?
3,111
Learners
369
Reviews
59
Answers
4.7
Rating
33
Courses
Hello! I am Neo, an instructor here at Inflearn.
My goal is to make various development technologies that are not commonly encountered accessible to many people.
Therefore, I aim to design a curriculum focused on practical application rather than a simple list of theories, providing hands-on lectures that allow for learning without troubleshooting hurdles.
I am structuring the content with a light and friendly approach so that even beginners can follow along without burden, focusing particularly on lowering the barrier to entry for knowledge.
Sometimes, I also work on lectures together with like-minded people!
For collaboration and other business inquiries, please contact yeseong0412@gmail.com!
All
10 lectures ∙ (52min)
All
38 reviews
4.4
38 reviews
Reviews 16
∙
Average Rating 5.0
5
I've heard a lot about how important monitoring is while studying backend development, but when I actually tried to implement Prometheus or Grafana myself, I didn't know where to start. This lecture was great because it organized those vague areas in a short and clean way. In particular, even though the course isn't long, it contains all the core essentials, so I was able to finish it without feeling overwhelmed. It really helped me understand the overall flow even as a beginner. I recommend this to anyone who is new to monitoring like I am. I look forward to the next lecture.
Thank you for taking the lecture! If you send a verification email with your Inflearn account to yeseong0412@gmail.com, I will issue a coupon so you can take the Springboot Actuator lecture for free!
Reviews 10
∙
Average Rating 5.0
5
1. I will try to create an environment where I can test locally. 2. I think this will be helpful for beginners rather than intermediate or advanced students. I hope you create intermediate and advanced courses later as well! It would be great if you could provide examples of how to handle actual deployment! Also, I think the content would be even richer if you explained how to integrate things like Loki and Promtail! There were some funny moments(?) in between, so I really enjoyed taking the course!!
Thank you for taking the course! I am currently preparing intermediate and advanced content covering Loki, as well as monitoring related to requests and responses! I will do my best to produce and share it as soon as possible. Thank you!
Reviews 12
∙
Average Rating 5.0
Reviews 14
∙
Average Rating 5.0
Reviews 24
∙
Average Rating 4.8
5
This is a course where you can build your own monitoring system in a short amount of time. Because it is concise, some advanced details are omitted, but it serves as an excellent guide for building a system first and then learning by adding necessary components later. Thanks to this, I was able to study and apply concepts that previously felt vague without any difficulty. Thank you!
Thank you for taking the lecture! If you send a verification email with your Inflearn account to yeseong0412@gmail.com, I will issue a coupon so you can take the Springboot Actuator lecture for free!
Check out other courses by the instructor!
Explore other courses in the same field!


![[Java Advanced Practical Project] Spring Core + H2 Based Food Truck Kiosk System DevelopmentCourse Thumbnail](https://cdn.inflearn.com/public/files/courses/336594/cover/01k8hetsq20rg69zw5ve0q5729?w=420)
![[Season 1] Spring AI in Action: Developing a Premium Reservation AI AgentCourse Thumbnail](https://cdn.inflearn.com/public/files/courses/339732/cover/01kb2qr7zw5gf0724jvv4rndns?w=420)