Document Automation with R and Python (Basics)
statisticsplaybook
Free
Basic / RMarkdown, LaTeX, R, Python
4.6
(16)
1,200+
You can build the basic stamina to leave work on time by automating report writing.
Basic
RMarkdown, LaTeX, R
Are you still drawing graphs in Excel? Let's improve the quality of graphs, which are the core of report writing. Are you looking up the ggplot function you use every day every time? Let's take this opportunity to organize it all.
Reviews from Early Learners
5.0
쿠카이든
Learned a lot about R! Thank you for the great lecture!
5.0
cosmo7
good lecture ~~
5.0
허종덕
Thank you for your effort
Summary of frequently used functions in the ggplot2 package
How to draw a graph for a research paper
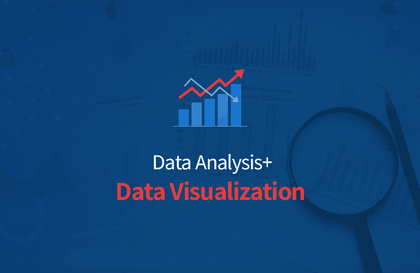
Data Visualization
Draw statistical graphs quickly with the ggplot2 package!
![]()
This course is designed to give those who have a basic understanding of R programming a taste of intermediate graphic techniques, while also quickly summarizing what those who have been using the ggplot2 package know.
For those who have taken my previous Inflearn lecture (Basic Statistics with R), this would be a good class to move on from the basic graphics used in the previous class to graphics that can be used in papers or reports using the ggplot2 package.
This lecture can be considered a summary or a taster course on statistical graphs. It is designed to help you naturally understand the concepts and methods of drawing graphs pursued by the ggplot package by following examples.
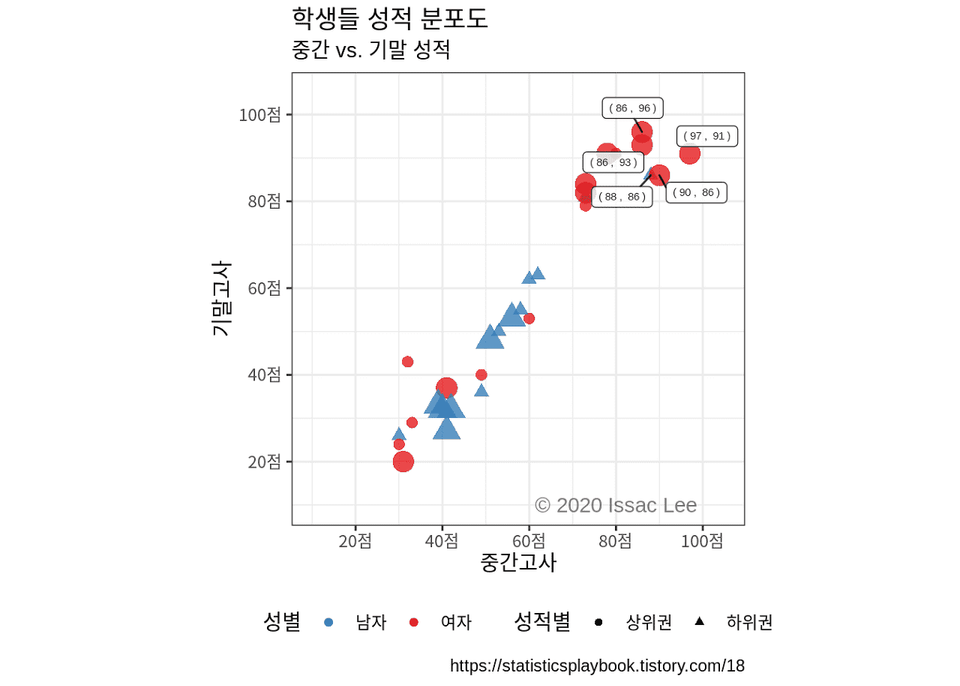
After completing the lecture, you will understand how to draw the following scatter plot.
As someone who has studied statistics for a long time and enjoys R programming, I created this to help out a little with my knowledge since there aren't many good materials in Korean available on the Internet. I hope my lectures will be helpful to some people who aren't familiar with R.
Anyone can learn anything. This is my homepage slogan and my motto. When studying statistics, or studying in general, there will often be moments when you feel frustrated by things you don't understand. Don't blame yourself. It's not because you're stupid or can't study, but it's probably because you didn't follow the right study order. Rather than thinking that you can't do it, figure out which part of your study is missing and try to fill it. I wish you success.
Who is this course right for?
Anyone who draws a graph for a paper in Excel?
Those who have already tasted the basics of R
If you use ggplot but are always confused
Need to know before starting?
You can just look at the R code, follow it, and then run it to check the results.
Understanding R basic code - data frame, basic if statement syntax
7,363
Learners
193
Reviews
42
Answers
4.8
Rating
5
Courses
Tôi muốn chia sẻ những gì mình đã học và nhận ra trong quá trình nghiên cứu thống kê với các bạn, những người đang đi trên con đường mà tôi đã từng đi qua. Hy vọng rằng đây sẽ là những bài giảng hữu ích giúp giải đáp thắc mắc cho một số người. Đồng thời, tôi cũng mong rằng dấu chân của mình, một người đi trước, sẽ phần nào trở thành niềm an ủi cho những ai đang bước đi trên con đường mà tôi đã từng đi.
Thân ái, Isaac.
Thống kê cuộc sống thông thái Đại diện
Nghiên cứu sinh Tiến sĩ (ABD), chuyên ngành Thống kê & Khoa học Định phí bảo hiểm, Đại học Iowa
Thạc sĩ Khoa học tính toán bảo hiểm, Đại học Sungkyunkwan
Bachelor's degree in Statistics and Industrial Engineering, Sungkyunkwan University
YouTube Channel: Wise Statistics Life
All
6 lectures ∙ (1hr 24min)
All
16 reviews
4.7
16 reviews
Reviews 8
∙
Average Rating 5.0
Reviews 1
∙
Average Rating 5.0
Reviews 320
∙
Average Rating 5.0
Reviews 522
∙
Average Rating 5.0
Reviews 28
∙
Average Rating 5.0
Check out other courses by the instructor!
Explore other courses in the same field!
Free