⏱️ From tedious overtime to becoming a top-tier Excel user who finishes work in just 3 minutes!
"The ultimate Excel practical cheat key that covers everything from basics to macro automation in a single course"
Are you still working late in front of your monitor, struggling with mysterious formula errors every time? It's time to put an end to meaningless time wasting.
We have compressed the field-proven know-how of a 14-year business MVP, verified by global corporations and major public institutions, into one single course.
- 📊 A seamless, perfect manual with a total of 109 lectures - 🗺️ A systematic build-up curriculum across 15 sessions - ⏱️ An overwhelming compressed guide finished in just 7 hours and 30 minutes
From users of older Excel versions (2019) to those who want to master the cheat keys of the latest 2026 version, we instill a powerful 'practical self-sufficiency' to solve problems on your own in any environment. Now, experience the confidence of leaving work on time!
🎓 The one and only master who will save your time, Edupick CEO Shin Eui-hyun
"Who you learn from determines your self-sufficiency in Excel practice."
Experience firsthand the know-how of a true expert who has educated countless professionals and majors in proven fields such as global corporations, public institutions, and university lecture halls.
- 🌐 Internationally Certified Trainer:** Apple Authorized Trainer / Avid Certified Instructor - 🏛️ Public Institutions & Major Corporations Lectures: KBS Training Institute, Korea Creative Content Agency (KOCCA), POSCO ICT, Hyundai Home Shopping, RAPA, KOBACO, etc. - 🏫 Prestigious University Education History: Practical lectures at Sejong University, Woosong University, Ajou University, Sangmyung University, Dongguk University Media Act, Chonbuk National University, Hanshin University, etc. - 📚 Field Practice & Bestselling Author: DI Team Leader for the movie 'Glove', OBS Drama Technology Team Leader / Bestselling author of business content
We deliver only the 'truly useful practical techniques' refined through numerous field experiences and employee training, rather than lectures biased toward theory.
⏱️ Just 7 hours and 30 minutes, the time it takes to go from an Excel beginner to a practical master
We have designed the most efficient build-up roadmap for busy professionals. Instead of long, tedious lectures, we condense the core essentials into just 15 sessions and a total of 109 lessons (averaging 30 minutes) to perfectly master practical tasks.
Just follow this systematic 3-step curriculum. We will wide open the high, locked walls of Excel for you.
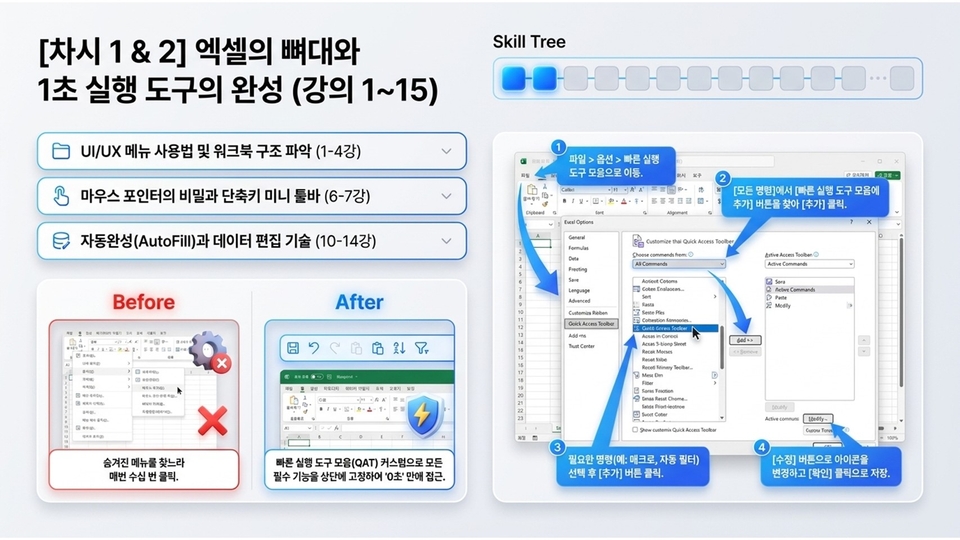
🛠️ [Session 1 & 2] The Foundation of Excel and Completion of 1-Second Execution Tools (Lectures 1-15)
"Are you still clicking your mouse dozens of times just to find hidden menus?"
This is the stage where you understand the basic structure of Excel and build your own optimized environment. Through custom settings that minimize mouse movement, you will reduce your work speed to the '0-second' range.
- 📁 Understanding Structure (Lectures 1-4): Mastering UI/UX menu usage and basic workbook structure - 🖱️ Path Optimization (Lectures 6-7): Secrets of the mouse pointer and utilizing shortcut mini toolbars - 💾 Editing Techniques (Lectures 10-14): AutoFill and efficient data editing skills
[Before ➡️ After] Put an end to the days of rummaging through top tabs every time. Create a smart routine by pinning essential, frequently used functions to the top through Quick Access Toolbar (QAT) customization for instant access.
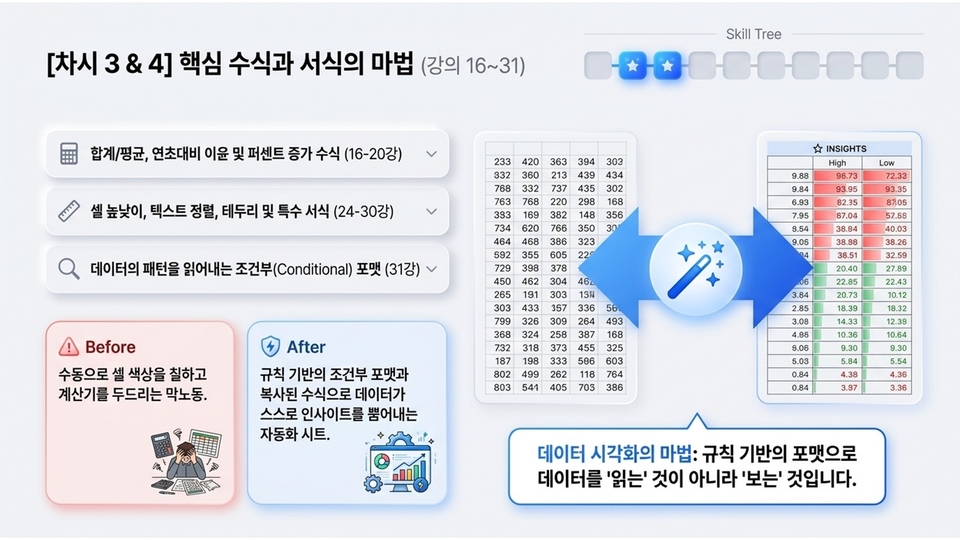
✨ [Lessons 3 & 4] The Magic of Core Formulas and Formatting (Lectures 16–31)
"Are you still doing manual labor, coloring cells by hand and tapping away at a calculator?"
This is the stage where you automate your sheets to automatically generate insights from vast amounts of data based on rules. Organize text and numbers to complete the foundation of a well-structured report.
- 🧮 Formula Basics (Lectures 16-20): Perfect mastery of formulas from sums/averages to year-over-year profit and percentage increases - 📐 Layout Formatting (Lectures 24-30): Designing cell heights, text alignment, borders, and special formatting - 🔍 Conditional Formatting (Lecture 31): Techniques to automatically read hidden patterns and flows in data
[Before ➡️ After] Don't stop at just 'reading' numbers. The magic of data visualization begins here, allowing you to 'see' the highs and lows of your data at a glance using rule-based formatting and copied formulas.
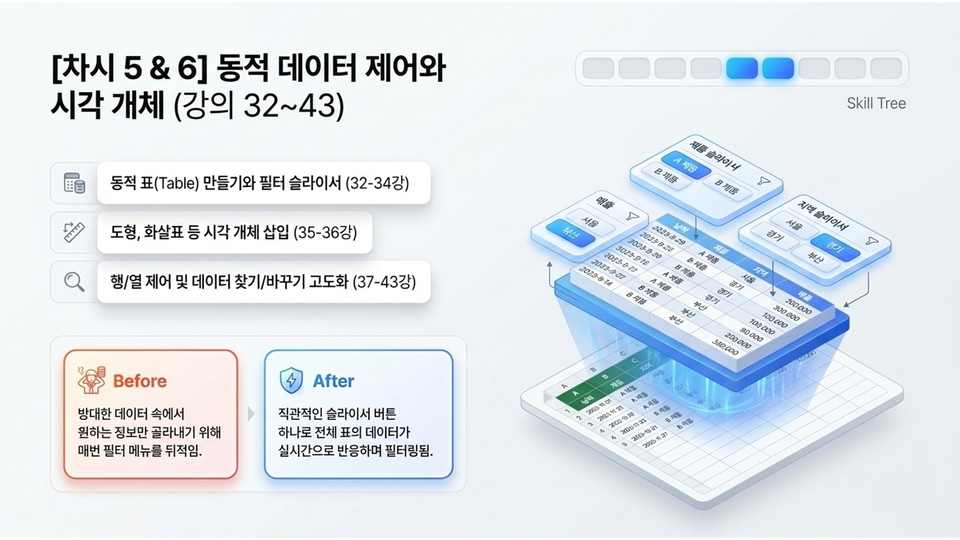
📊 [Session 5 & 6] Dynamic Data Control and Visual Objects (Lectures 32-43)
"Are you still rummaging through narrow filter menus every time just to pick out the information you want?"
This is the advanced layout build-up stage where you structure vast data sheets and control all data in real-time with a single button click.
- 🧮 Dynamic Data (Lectures 32-34): Creating dynamic tables and linking filter slicers - 📐 Visualization Layout (Lectures 35-36): Inserting visual objects such as shapes and arrows to enhance report quality - 🔍 Data Advancement (Lectures 37-43): Mastering row/column control and advanced find/replace techniques
[Before ➡️ After] Don't get lost in your data. You will be able to build a smart dashboard environment where the entire table's data filters and reacts in real-time with a single intuitive slicer button.
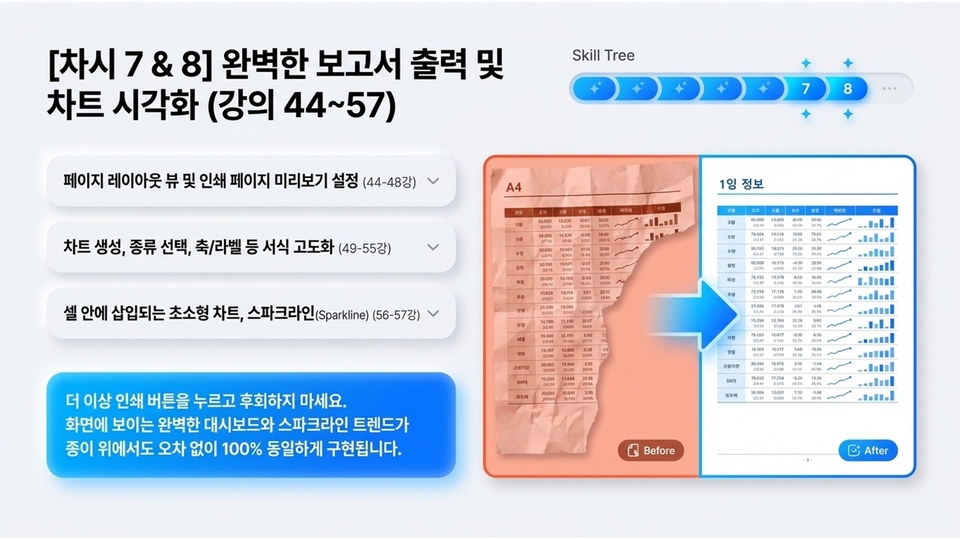
"Have you ever been flustered because your tables were cut off or broken every time you pressed the print button?"
This stage is about implementing the perfect data seen on the screen 100% identically on paper or in PDF reports without errors, while adding visual persuasiveness.
- 🖨️ Output Optimization (Lectures 44-48): A complete guide to Page Layout View and Print Page Preview settings - 📊 Advanced Charting (Lectures 49-55): Creating charts suitable for data, selecting types, and advanced formatting of axes/labels, etc. - 📉 Micro Trends (Lectures 56-57): Utilizing Sparklines that are neatly inserted into cells to show trends
[Before ➡️ After] No more regrets after pressing the print button. Neatly organized print layouts and cell-level sparkline trends will elevate the quality of your reports to the next level.
⚡ [Lessons 9 & 10] Controlling Large Sheets and Practical Killer Functions (Lectures 58-73)
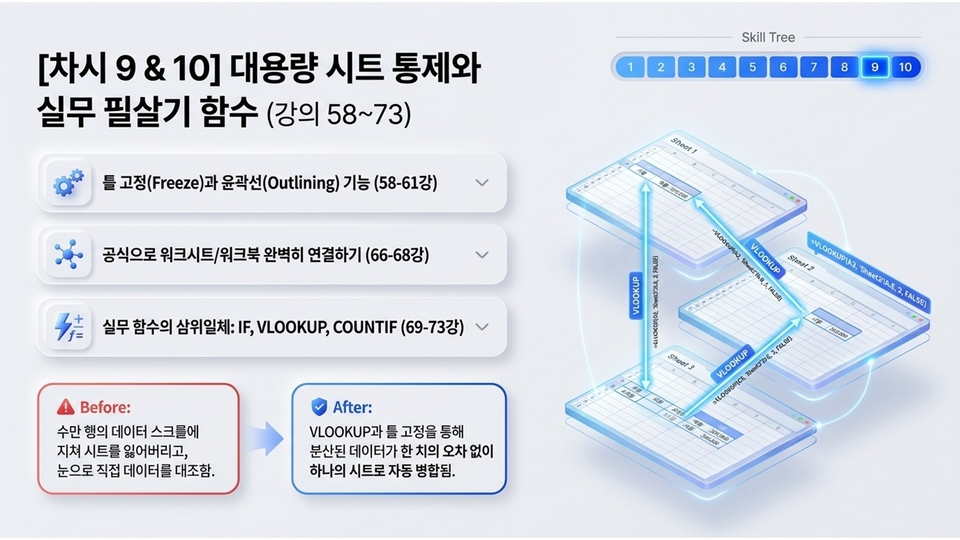
"Are you getting lost while scrolling through tens of thousands of rows of data, or manually comparing data with your own eyes?"
This stage is about perfectly connecting massive workbooks and mastering the three core practical functions to automatically merge scattered data all at once.
- ⚙️ Sheet Control (Lectures 58-61): Ensuring readability of large sheets with Freeze Panes and Outlining features - 🔗 Data Linking (Lectures 66-68): Perfectly linking multiple worksheets/workbooks using formulas and equations - ⚡ Essential Practical Functions (Lectures 69-73): The holy trinity of practical functions! Complete mastery of IF, VLOOKUP, and COUNTIF
[Before ➡️ After] Stop straining your eyes and fingers. Experience the amazing transformation where vast amounts of scattered data are automatically merged into a single master sheet without a single error through VLOOKUP and Freeze Panes.
🔒 [Session 11 & 12] Ironclad Security Settings and Advanced Data Filtering (Lectures 74–87)
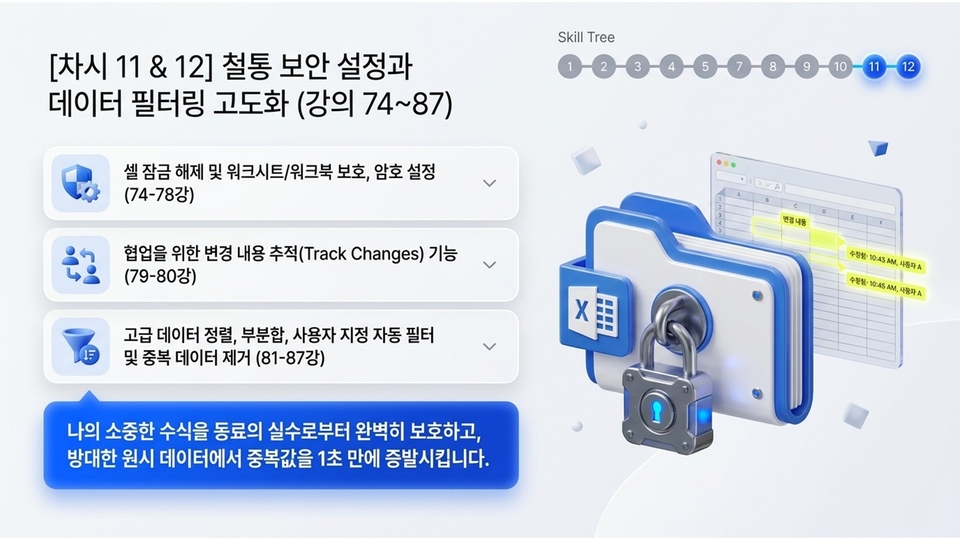
"Have you ever had a carefully crafted formula deleted or broken by someone else's mistake?"
This stage is about perfectly protecting your precious data during collaboration and neatly filtering out unnecessary duplicates from vast raw data in just one second.
- 🛡️ Ironclad Security (Lectures 74-78): Defending data formulas by unlocking cells, protecting worksheets/workbooks, and setting passwords - 👥 Safe Collaboration (Lectures 79-80): The Track Changes feature that shines when working with colleagues - 🔍 Advanced Filtering (Lectures 81-87): Advanced data sorting, subtotals, custom auto-filters, and removing duplicate data
[Key Points] Perfectly protect your precious formulas from colleagues' mistakes! By mastering sorting and subtotal techniques, you can smoothly pick out only the insights you want from tens of thousands of data points.
🗂️ [Session 13] The Ultimate Guide to Data Analysis: Mastering Pivot Tables (Lectures 88–97)
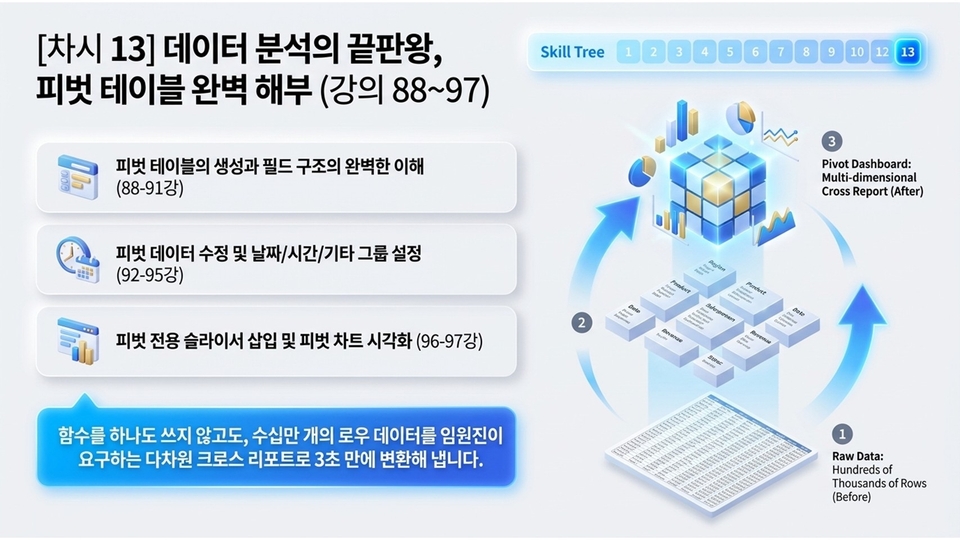
"Transform hundreds of thousands of rows of raw data into multi-dimensional reports without using a single function."
This stage allows you to summarize vast amounts of data with just a few clicks and drags—no complex formulas or coding required—and generate the perfect cross-reports requested by executives in just 3 seconds.
- 🏗️ Understanding Structure (Lectures 88-91): Grasping the complete mechanism of pivot table creation and field structures - 📆 Group Optimization (Lectures 92-95): Modifying pivot data and handling date/time/other grouping settings - 📊 Chart Visualization (Lectures 96-97): Inserting pivot-specific slicers and visualizing with intuitive pivot charts
[Key Points] Don't get lost in a pile of raw data. Once you master the pivot dashboard features, hundreds of thousands of rows of data will be reborn as multi-dimensional cross-reports that radiate insights on their own.
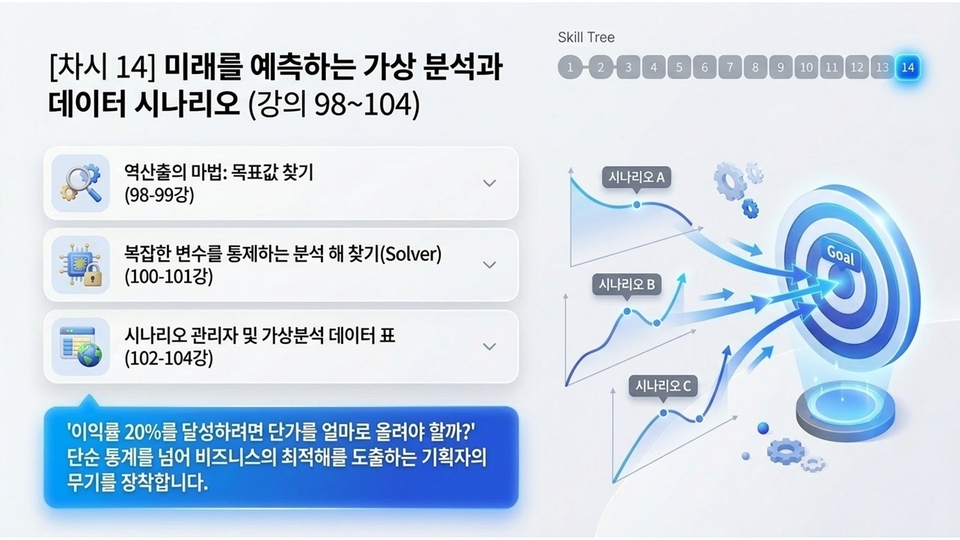
🎯 [Session 14] What-If Analysis and Data Scenarios for Predicting the Future (Lectures 98-104)
"Equip yourself with the planner's weapon that goes beyond simple statistics to derive optimal business solutions."
This stage involves back-calculating variables to achieve specific goals, such as 'achieving a 20% profit margin,' and simulating predictive data based on various business situations (Scenarios A, B, and C).
- 🔍 The Magic of Back-calculation (Lectures 98-99): Goal Seek to find the input value needed to achieve a desired result - 🎛️ Controlling Variables (Lectures 100-101): Using Solver to analyze and control complex constraints and variables - 📊 Predictive Simulation (Lectures 102-104): How to use Scenario Manager and What-If Analysis Data Tables
[Key Points] Stop writing proposals based on vague guesses. By mastering What-If analysis tools, you will become a top-tier planner capable of deriving accurate target data even amidst diverse business variables.
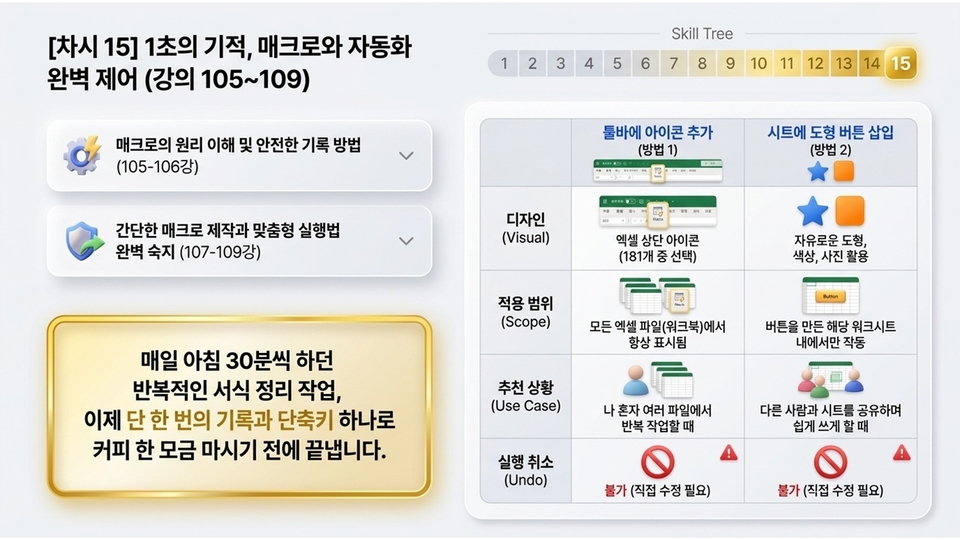
⚙️ [Session 15] The 1-Second Miracle: Perfect Control of Macros and Automation (Lectures 105–109)
"How much longer are you going to manually handle the repetitive formatting tasks that take 30 minutes every morning?"
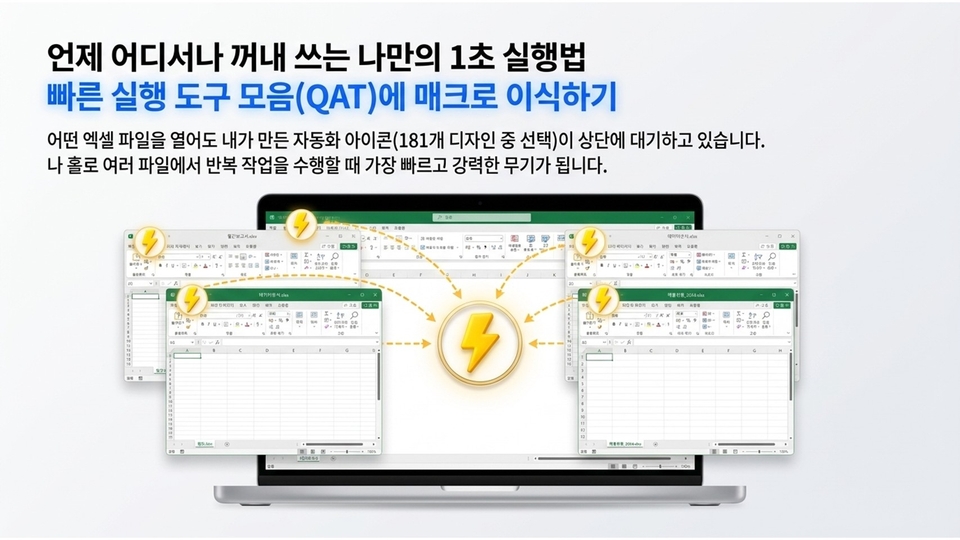
This stage is about completely automating tedious routine tasks through a single recording and shortcut assignment. You will clearly master the differences between adding toolbar icons and inserting buttons within a sheet.
- ⚙️ Automation Mechanism (Lectures 105-106): Understanding the principles of macros and safe recording methods without errors - 🖱️ Customized Execution (Lectures 107-109): Creating simple macros and mastering the optimal execution methods for any situation
[Before ➡️ After] Experience the amazing miracle of finishing your work before you even take a sip of coffee, using just a shortcut or a shape button. Equip yourself with the automation cheat code to perfectly control everything from personal files to sheets shared with colleagues.
👑 Edupick's overwhelming course satisfaction, already proven by countless professionals
Edupick goes beyond simple feature delivery, aiming for optimal practical education that allows students to achieve immediate results in the field.
In addition to this [Top-tier Exceller] course presented on Inflearn, various business practical contents provided by Edupick have already received overwhelming satisfaction and high praise from numerous junior employees and managers.
- 📈 Field-focused examples: A 100% practical curriculum used directly in real work, not just a list of theories - ⏱️ Incomparable efficiency: A clear and compact compressed guide that saves time for busy professionals - 💬 Real endorsements from seniors: Reliability proven by verified student reviews, from new employees leaving on time to managers' reports being approved
The 'miracle of leaving work on time' and work efficiency routines experienced by countless professionals will now be transplanted directly into your environment. Become a top-tier professional with Edupick's proven education!
Recommended for these people
Who is this course right for?
Someone who is new to Excel
People who want to learn Excel systematically from the basics
















![[Master] Mastering Vegas Pro: Building a Solid Foundation CourseCourse Thumbnail](https://cdn.inflearn.com/public/courses/333400/cover/8c977d98-4ade-4399-a43f-5242dcdf3abc/333400.png?w=420)
![[Master] Logic Pro X Fundamentals CourseCourse Thumbnail](https://cdn.inflearn.com/public/courses/333265/cover/c2abe6f9-5ed2-49a9-99de-b2d15085b52d/333265.png?w=420)
![[Master] Basic Sturdy Audition CourseCourse Thumbnail](https://cdn.inflearn.com/public/courses/333264/cover/a3d399a6-6aa3-4c70-814b-1718876c6170/333264.png?w=420)
![[Master] After Effects CC: Building a Solid Foundation CourseCourse Thumbnail](https://cdn.inflearn.com/public/courses/333257/cover/2e365cbe-6ec2-49d3-98fb-73733422e4db/333257.png?w=420)
![[Master] Basic Sturdy Cinema 4D CourseCourse Thumbnail](https://cdn.inflearn.com/public/courses/333255/cover/1eb2a41f-6185-49cf-9981-1bda1d85725d/333255.png?w=420)
![[Master] Follow along with 101 basic and solid Premiere Pro effectsCourse Thumbnail](https://cdn.inflearn.com/public/courses/330105/cover/cd958f98-bb07-438c-a623-8be198a61ac2/330105.png?w=420)
![[Advanced] Mastering Excel: Building a Solid Foundation CourseCourse Thumbnail](https://cdn.inflearn.com/public/files/courses/330004/cover/01m04tf9hsr0m5gzxrskce1nja?w=420)

![[Intermediate] Mastering Excel with a Solid Foundation CourseCourse Thumbnail](https://cdn.inflearn.com/public/files/courses/330003/cover/01m04pa6n703t49hn2dmwpy0ct?w=420)
![[Master] Solid Fundamentals PowerPoint CourseCourse Thumbnail](https://cdn.inflearn.com/public/courses/330000/cover/19ad29a7-7db7-4a4d-830d-e579c9044c79/330000.png?w=420)
![[Advanced] Mastering Basic Solid Vocabulary CourseCourse Thumbnail](https://cdn.inflearn.com/public/files/courses/329993/cover/01m05r0fqknfxtp3x8z47xe9wv?w=420)
![[Intermediate] Mastering Basic Vocabulary with a Solid Foundation CourseCourse Thumbnail](https://cdn.inflearn.com/public/files/courses/329992/cover/01m05qy1cw6ff6j32fmydcqjrb?w=420)
![[Beginner] Mastering Basic Vocabulary with a Strong Foundation CourseCourse Thumbnail](https://cdn.inflearn.com/public/files/courses/329990/cover/01m05qtvdpfm5nx33ywnh2d2t0?w=420)
![[Master] Basic Strong Motion 5 Conquering CourseCourse Thumbnail](https://cdn.inflearn.com/public/courses/329588/cover/b6f491b5-34d8-48f4-8b94-73c22cc0bcf0/329588.png?w=420)
![[Master] Basic and Solid Illustrator Conquer CourseCourse Thumbnail](https://cdn.inflearn.com/public/courses/329341/cover/216064dd-742e-416b-8e29-863ef43ec2db/329341.png?w=420)
![[Master] Basic and Strong Premiere Pro Conquer CourseCourse Thumbnail](https://cdn.inflearn.com/public/courses/328934/cover/70ec442d-5829-4096-bfe0-8ff9593dad04/328934.png?w=420)
![[Master] Basic and Strong Final Cut Pro X CourseCourse Thumbnail](https://cdn.inflearn.com/public/courses/328720/cover/d98b81f5-001e-4ab1-840b-a151cbe889dd/328720.png?w=420)
![[Master] Basic Strong Cubase Conquering CourseCourse Thumbnail](https://cdn.inflearn.com/public/courses/328633/cover/788fb022-34ce-4708-922b-93ef45644a61/328633.png?w=420)

![[Episode] Excel + Python (Basic)Course Thumbnail](https://cdn.inflearn.com/public/courses/332174/cover/4bff11a1-9859-43f4-8e17-6374ee50e6d6/332174-eng.png?w=420)
![[Pass ITQ Excel A in One Go] in 3 daysCourse Thumbnail](https://cdn.inflearn.com/public/courses/329652/cover/b44e11b6-a47e-4993-86ea-a85da9836bb5/329652-eng.png?w=420)


![[AI Cheat Key] The Document-Work Booster Office Workers Have Been Waiting For: Claude in Excel & PowerPointCourse Thumbnail](https://cdn.inflearn.com/public/files/courses/343890/cover/ai/3/9cda404e-27b4-4a30-9003-b48a6d42f992.png?w=420)

![[Star Instructor Teacher Choi] The Standard for Passing Quickly|ITQ Excel MasterCourse Thumbnail](https://cdn.inflearn.com/public/files/courses/343264/cover/01kxzse3ftyrhrd3te3b03e3ch?w=420)

![[For Beginners] Data Visualization with Power BICourse Thumbnail](https://cdn.inflearn.com/public/courses/327055/cover/455b54c1-3e63-439b-9b60-5d12e12bc303/PowerBI-001 (1).png?w=420)