![[著者直講]実務例で終わるRデータ分析講義サムネイル](https://cdn.inflearn.com/public/courses/328429/cover/0e68ecdb-65d3-4da8-8ca7-ecbddf079cc4/328429-eng.png?w=420)
[著者直講]実務例で終わるRデータ分析
junyoung85179634
¥4,334
初級 / R
1.0
(1)
データアナリストのために準備した "実務例に基づくデータ分析"講義です。
初級
R
Tableauのさまざまな機能を理解する基礎から始めて、実務例である売上分析ダッシュボードまで、全コースを1つの講義で盛り込んでいます。

Tableauの全体を理解することができます。
データ可視化アプローチを理解することができます。
売上ダッシュボードを作成できます。
Tableauを使用したデータの可視化
基礎から実務例まで!
この講義では、私が約8年間データ分析とダッシュボード構築プロジェクトを遂行する過程で活用してきたデータ視覚化のアプローチを知り、直接フォローしながらTableauに対する全般を理解します。
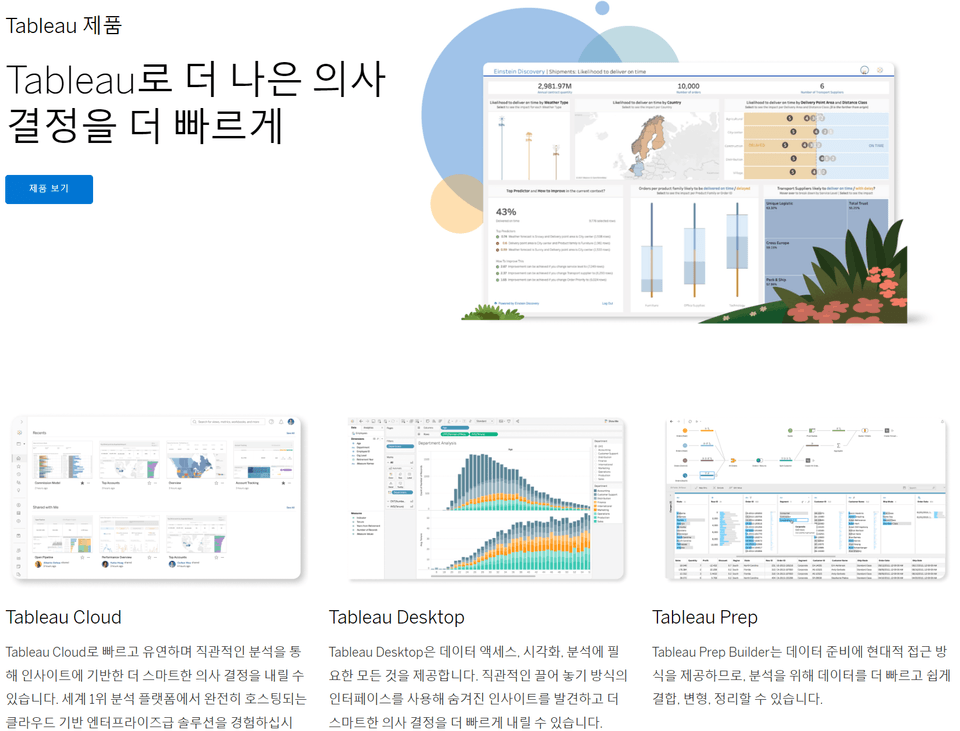
Tableauは、データから重要な情報を導き出し、迅速に意思決定を行うのに役立つBusiness Intelligenceツールです。

習得しやすさ
コーディングしなくても
データを可視化できます
あります。

利便性
サイズや範囲に関係なく
簡単にデータをインポート
できます。

インタラクティブダッシュボード
複数の可視化チャートを集めて
ダッシュボードを作成できます
あります。
さまざまなデータ可視化アプローチを通じて
データからインサイトの導出方法を育ててください!
市販の書籍やレッスンは、データ分析に必要な理論やプログラミングの基礎を扱うことがよくあります。
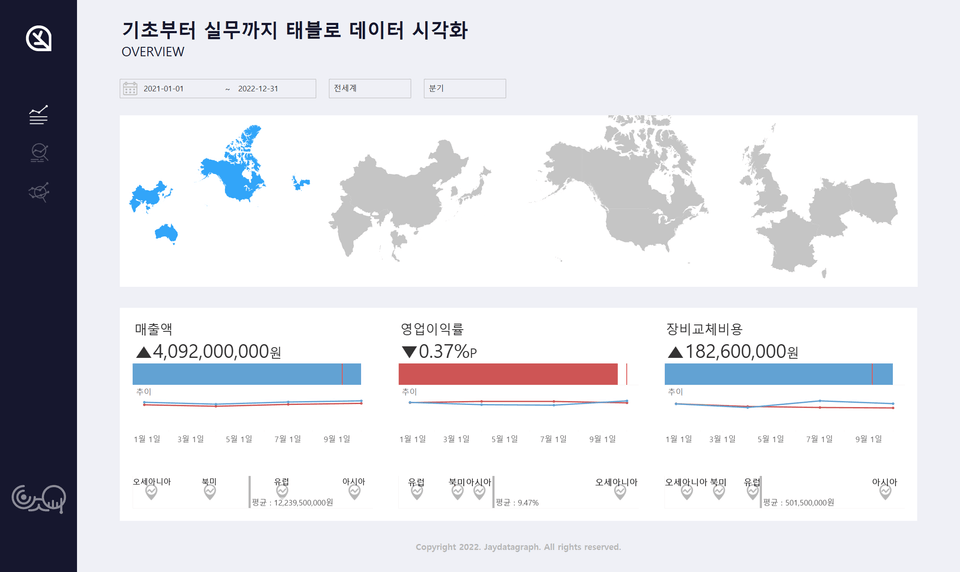
売上分析の実務例を通じて
現場に必要なヒントを学びましょう!
企業は営利を追求する組織で財貨や用役を生産して販売し、この過程で売上高データが発生するのを助けます。
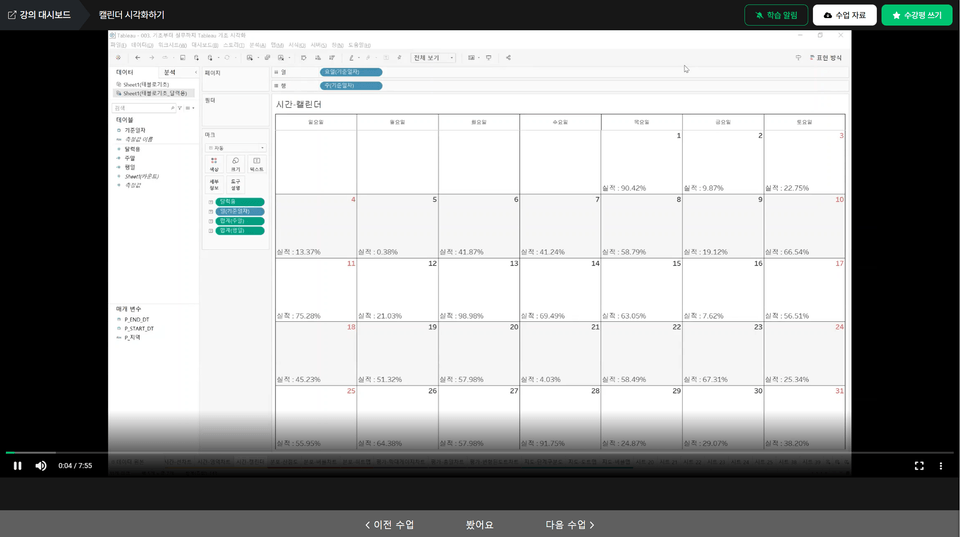
受講に必要な資料は下記の講義画面で右上にある「授業資料」をクリックして資料をダウンロードして受講を進めることができます。
学習対象は
誰でしょう?
データ分析に経験がない人
Pythonコードで疲れた人
データから迅速にインサイトを導出する必要がある人
社内にTableauを導入してツールを活用する必要がある人
99
受講生
8
受講レビュー
6
回答
3.9
講座評価
2
講座
全体
39件 ∙ (3時間 55分)
講座資料(こうぎしりょう):
1. Tableau のインストール
09:12
3. データ可視化アプローチを理解する
03:50
4. 学習評価
02:36
5. 整理する
03:08
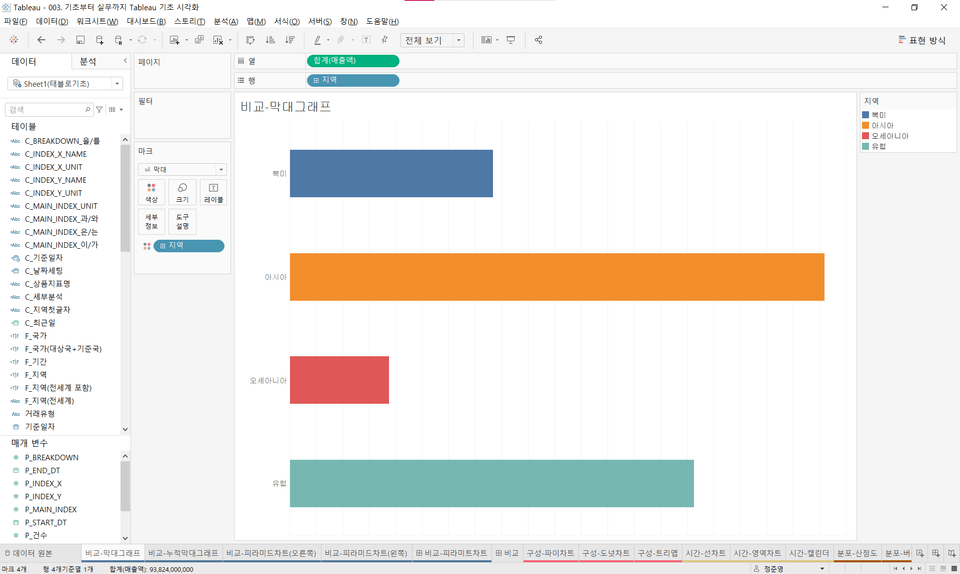
6. データ可視化アプローチ - 比較
00:52
7. バーグラフを可視化する
05:59
8. 積み上げ棒グラフの可視化
04:31
9. ピラミッドチャートを視覚化する
06:14
10. データ可視化アプローチ - 構成
00:51
11. 円グラフを視覚化する
03:11
12. ドーナツチャートを視覚化する
08:52
13. ツリーマップの視覚化
02:36
全体
7件
4.3
7件の受講レビュー
受講レビュー 6
∙
平均評価 4.7
受講レビュー 9
∙
平均評価 5.0
受講レビュー 4
∙
平均評価 4.8
受講レビュー 1
∙
平均評価 5.0
受講レビュー 8
∙
平均評価 5.0
知識共有者の他の講座を見てみましょう!
同じ分野の他の講座を見てみましょう!
新規会員登録で25%OFF
¥5,282
25%
¥7,042


![[ディペックアップ_PASS] 国家技術 経営情報視覚化能力(筆記)講義サムネイル](https://cdn.inflearn.com/public/files/courses/336327/cover/01jytyqa2egrzn52a7m57fntzk?w=420)