Oh, I didn't know there was such a great lecture.. Thank you so much~!!
5.0
수원양민
100% enrolled
Thank you for the great lecture.
5.0
권범석
100% enrolled
Good
What you will gain after the course
How to use scikit-learn, an essential package for Python machine learning
Major machine learning algorithms for supervised and unsupervised learning
How to make Netflix? Movie recommendation system project
Text analysis is a bonus!
With Python Machine Learning Create a movie recommendation system! 🎞️
Step-by-step, from machine learning theory to practice! 🖥️
You've probably heard of machine learning, right? Machine learning is a branch of artificial intelligence, known in Korean as " machine learning ." Given high-quality data, the system learns from that data and creates a model . Using this model, the system predicts the output from new inputs—in other words, it's essentially creating a function.
By the way, this is not it :)
You can never experience all the rides at a large amusement park in one day. But once you visit, you'll get a general idea of what the park looks like, where the rides are located, and which rides to prioritize the next time you visit.
I hope you'll study my lectures like you're visiting an amusement park for the first time. While it's difficult to know everything about machine learning, you'll gain a sense of what it is, what you need to consider for learning, and what you might want to study further. Then, you'll be able to take it a step further and build a deeper understanding through a variety of resources. Let's get started.
Learn this 📑
1) Solid theoretical learning
Here are some points sprinkled throughout.
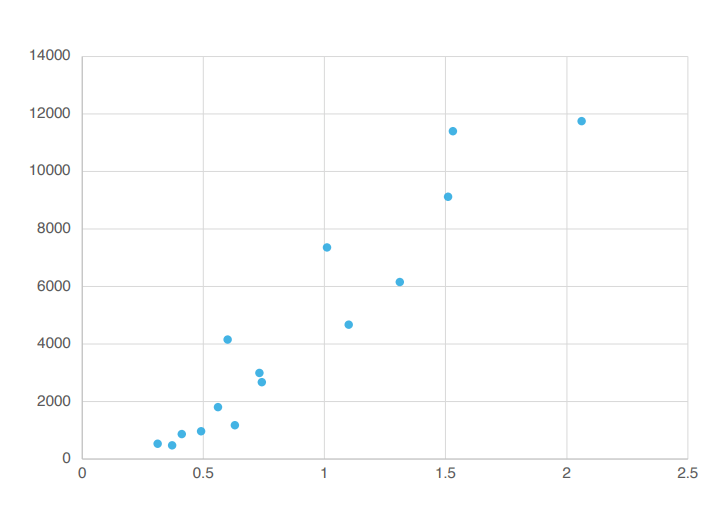
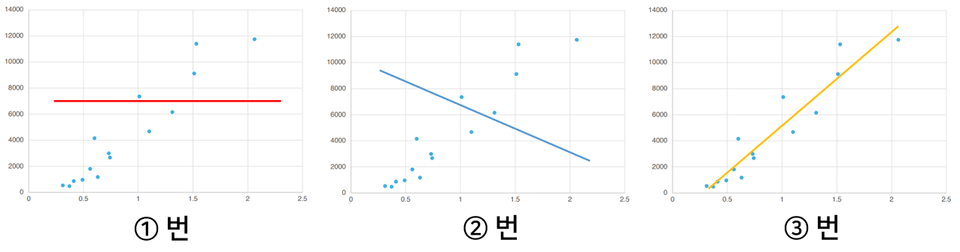
If you had to find just one straight line that best represents these points, what would it be?
That's right! It's number 3. Why did you think that? That's right. It just seems that way, right?
We've just experienced the process of a machine learning to build a model on its own. Once this model (in this case, a straight line) is created, we can now make predictions .
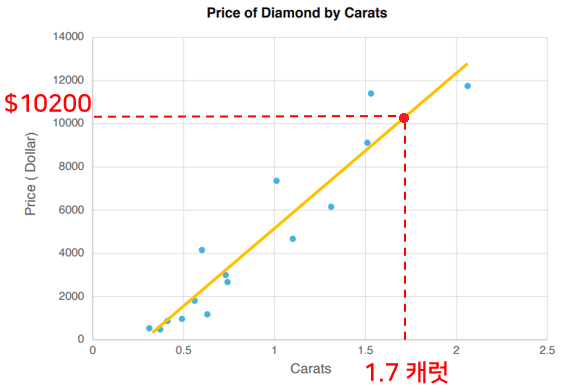
If this graph represents diamond price data by carat, with carats on the x-axis and price on the y-axis, you can roughly estimate how much a new 1.7-carat diamond would cost. Making predictions using continuous numerical data like this is called a regression model .
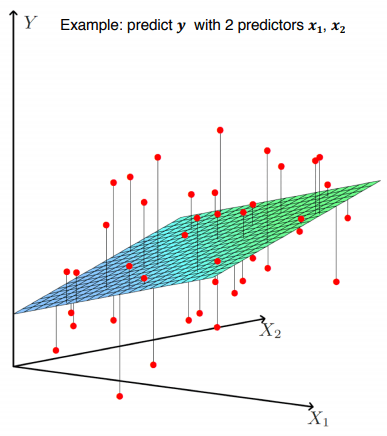
Regression models can sometimes become more complex. For example, if you're trying to predict test scores based on study time, study time isn't necessarily the only factor that influences the score, right? These factors that influence the test score are called independent variables , and the resulting outcome is called the dependent variable . As the number of independent variables increases, a more complex form of multiple linear regression model becomes necessary. Think of it as the graph becoming more complex as the dimensionality increases.
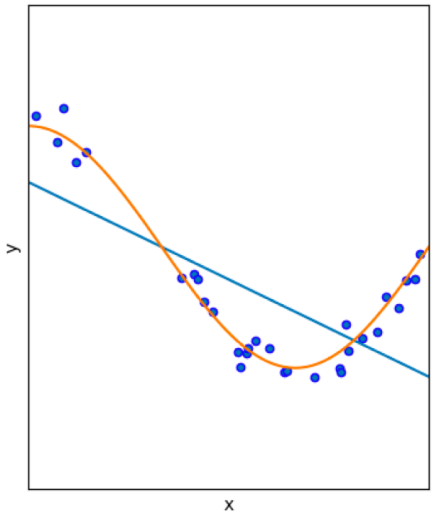
During the hot summer months, it's scary to use the air conditioner for long periods of time. Household electricity bills are subject to progressive tariffs, so even after a short period of use, electricity bills can skyrocket, sometimes exceeding hundreds of thousands of won. In cases where y changes rapidly in response to changes in x, such as data that increases dramatically depending on the progressive tariff, it's difficult to express them with a single straight line. In these cases, a polynomial regression model can be used.
When you have two models to represent the data of the blue dots, the orange curve is much better than the straight blue one!
But how can we be sure that these predictive models truly perform well? So, once a model is built, its performance must be evaluated. To do this, the entire dataset is split into two: one for training and one for testing. Typically, the split is 80:20, training is performed solely on the training set, and the model is then validated on the test set. In some cases, the sets are mixed for validation.
In this process, if the model predicts very well on the training set but poorly on the test set, this is called overfitting . If the model predicts poorly even on the training set, this is called underfitting . When building a model, it's important to avoid overfitting or underfitting.
A kid who is roughly overfitting to grandma's data
I saw something, but it was 2% lacking.
In addition to continuous data, there's also categorical data. This involves classification , not regression . Instead of test scores based on study time, consider categorical data, which, in this case, is categorized as pass/fail, based on a certification exam. So, if you have data indicating that someone who studied for four hours failed and someone who studied for six hours passed, you'd categorize those who studied for seven hours as either passing or failing.
A representative classification algorithm in machine learning is logistic regression . While it's called regression, it's actually a model used for classification, and classification models can adjust their criteria as needed. For example, even if the model says , "You'll pass if you study for four hours," we might take a conservative approach and say, "You'll need to study for six hours."
The content explained so far falls under the supervised category of machine learning . However, there's also unsupervised learning, which doesn't provide the correct answer. Unsupervised learning involves the machine discovering meaningful patterns or structures within data. Clustering, which groups data exhibiting similar patterns together, is an example of clustering. Dividing news articles into categories like science/technology, sports, and health is an example of clustering.
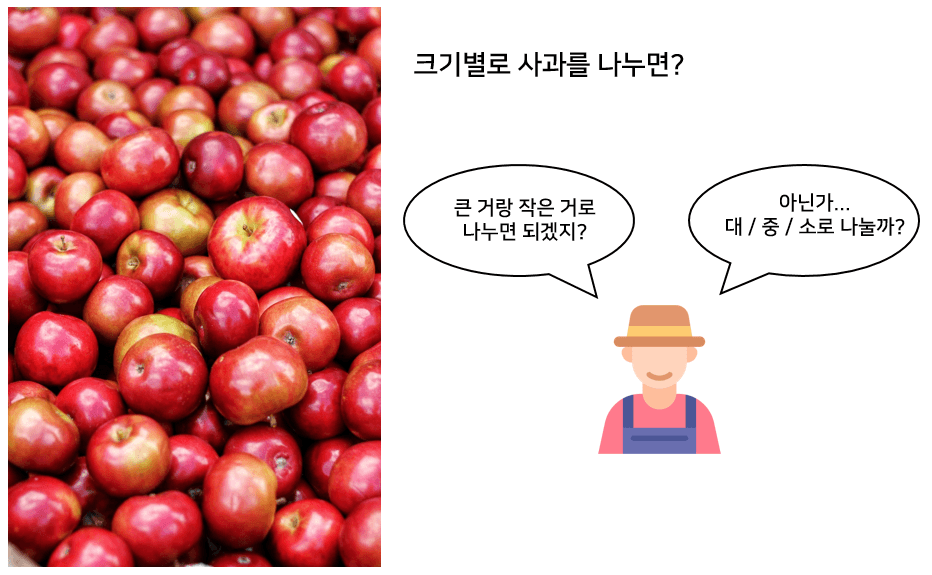
A representative clustering algorithm is K-means . Imagine you're picking apples from an orchard and dividing them for sale. What's the best way to do it? You could simply divide them into two groups: large and small. Or you could divide them into three groups: large, medium, and small. Or you could categorize them into pretty and ugly groups, selling the ugly ones at a lower price.
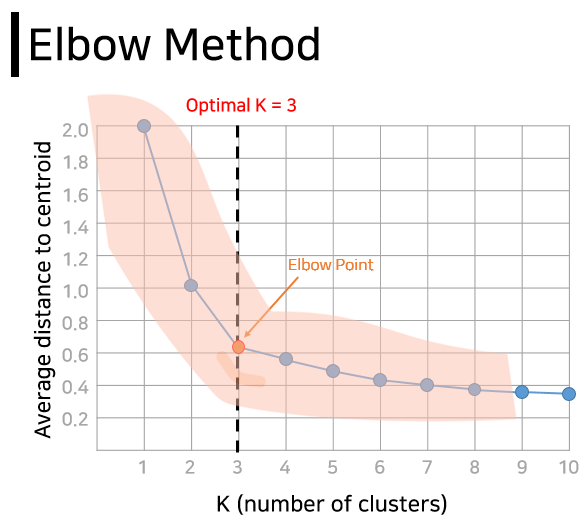
Here, K is the number of groups . If you are clustering a large amount of complex data, not just apples, it can be difficult to decide on a number . Fortunately, there is a method that can be referred to to find the optimal K. It is called the elbow method because it resembles the shape of an elbow. Simply put, it calculates the average distance from each data to the center of each cluster (group) according to the change in K, and considers the point at which the slope on the graph begins to become gentle as K.
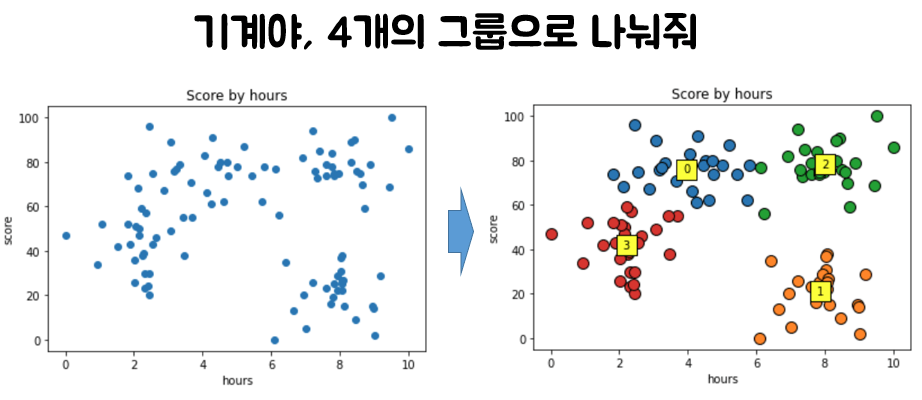
Once K is determined, we can obtain results divided into K clusters (groups) from the randomly scattered data, as shown below. If this example were to show scores based on study time, we could offer different study strategies to students in each group.
2) Practice and quizzes
The fundamentals of machine learning covered above will be covered through detailed theoretical explanations and practical exercises. Finally, a quiz will be administered to review what you've learned.
The quiz only gives you a data set and seven small tasks to complete using that data. If you've studied the basics well, you'll be able to handle it. And being able to solve the quiz on your own means you'll be able to separate the data, learn from the training set, visualize the data, and even perform evaluation and predictions. Awesome, right? 😃
Now that you've completed the quiz, it's time to put it to use! As with all other application-oriented lectures, this machine learning course will also involve a project. The project topic is a movie recommendation system . Using a dataset of approximately 5,000 movies, you'll analyze and learn to select 10 recommended movies. There are several recommendation methods, but we'll briefly cover the following three.
1. Recommend a movie that many people like 2. Recommend movies that are very similar to a specific movie. 3. Customized recommendations based on individual movie tastes
In this course, you'll also learn a bit about text analysis methods. And since just looking at code can be tedious, we'll build our own movie recommendation system using Streamlit, a package that lets you create beautiful web pages with just a few lines of code. Here, when you select a movie, it will recommend 10 movies based on information like the film's genre, director, and cast, and then display a Korean poster image. Sounds pretty good, right?
In particular, the last personalized recommendation based on individual movie tastes uses a package called Surprise. Based on the sales history data accumulated so far, it can be of great help in developing strategies such as which products to recommend to which customers, and which items would sell better if sold as a set.
Images, Videos by pixabay, pexels : https://www.pixabay.com : https://www.pexels.com
Designed by freepik, flaticon : https://www.freepik.com : https://www.flaticon.com
Recommended for these people
Who is this course right for?
For those who found machine learning difficult
For those who need a really easy and detailed explanation
For those who want to complete their knowledge through practical projects that go beyond theory
I'm Nadocoding, and I run a coding education channel on YouTube. I provide lectures with kind explanations and easy examples so that anyone can study coding in a fun and simple way. Shall we code together? 😊


![[Tensorflow2] Complete conquest of Python deep learning - Latest techniques of GAN, BERT, RNN, CNNCourse Thumbnail](https://cdn.inflearn.com/public/courses/324484/course_cover/f6f03229-d156-4a27-a0f2-ede2361c586f/sjh_Deep_Learning.png?w=420)


![[The Ultimate Manufacturing DX] AI Practical Application Strategy Master Class for 7 Major IndustriesCourse Thumbnail](https://cdn.inflearn.com/public/files/courses/342169/cover/ai/2/e0850074-3049-4f98-b6db-611d07ea5083.png?w=420)
![[ICT Archive] Big Data Core and Business ModelsCourse Thumbnail](https://cdn.inflearn.com/public/files/courses/338811/cover/01k44rs7zkwq0ehc8vqsy2mdtb?w=420)