hello.
📊Thank you for taking the course Finding Signal and Noise by Collecting and Analyzing Securities Data📈.
We've added quizzes to each chapter so you can check what you've learned.
Quizzes are collected anonymously for grading and can be taken multiple times.
Also, the quiz results may be used to improve the content. They are collected anonymously, so it's okay if you take the quiz multiple times and get it wrong.
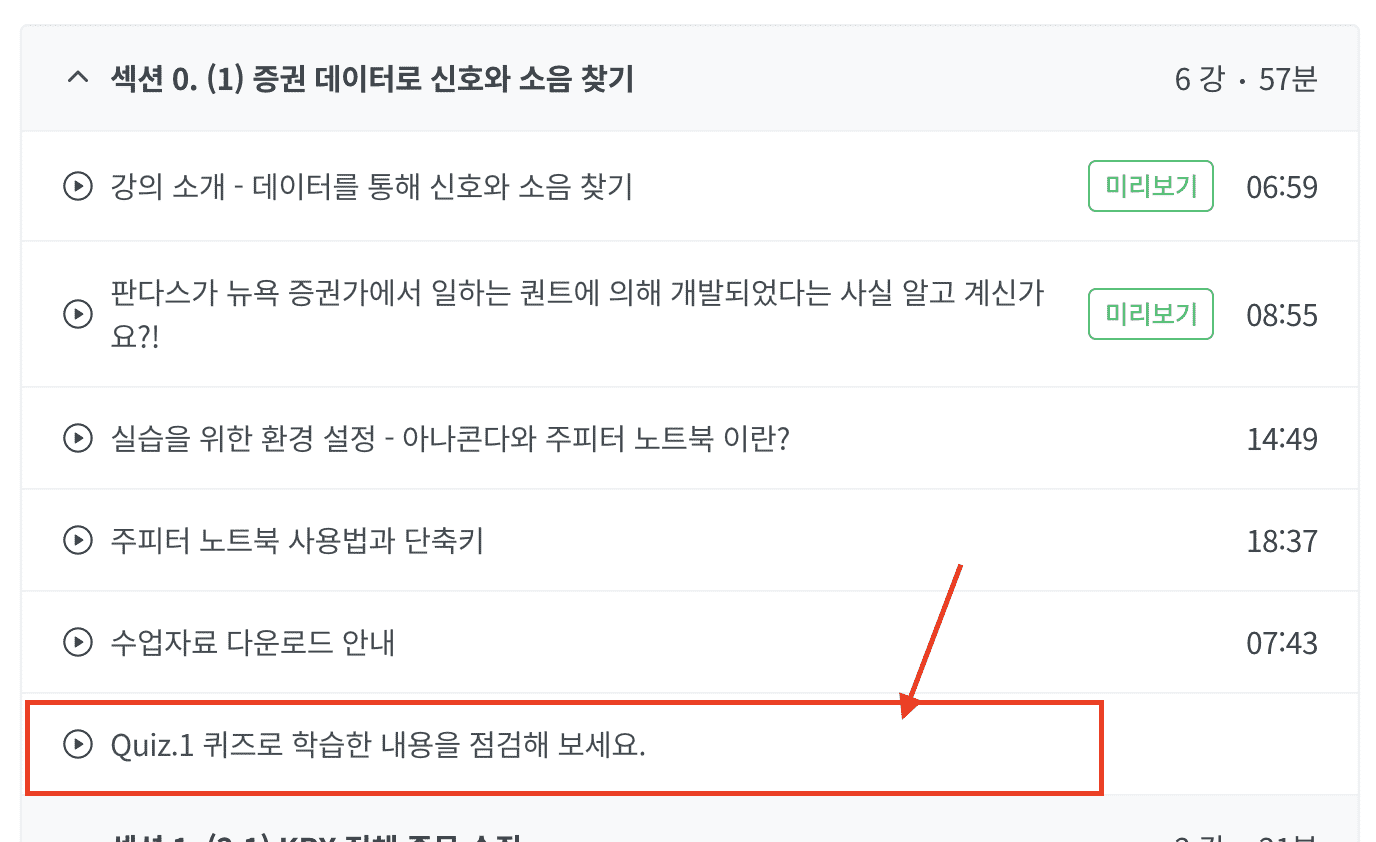
As shown in the attached screenshot below, it is organized so that you can solve it at the end of each chapter.
I hope this helps you understand and review the learning content.
Have a nice day! 😊
thank you
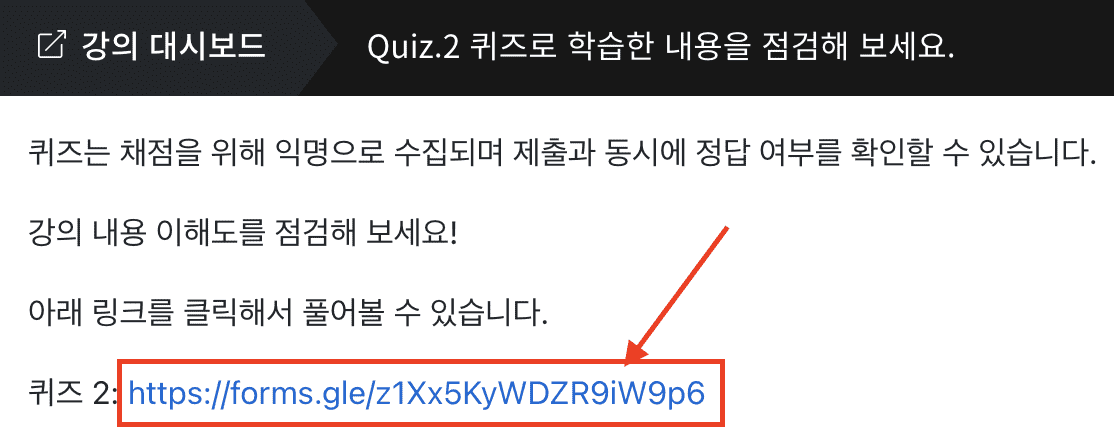
You can click within the lecture and solve it as a Google form .
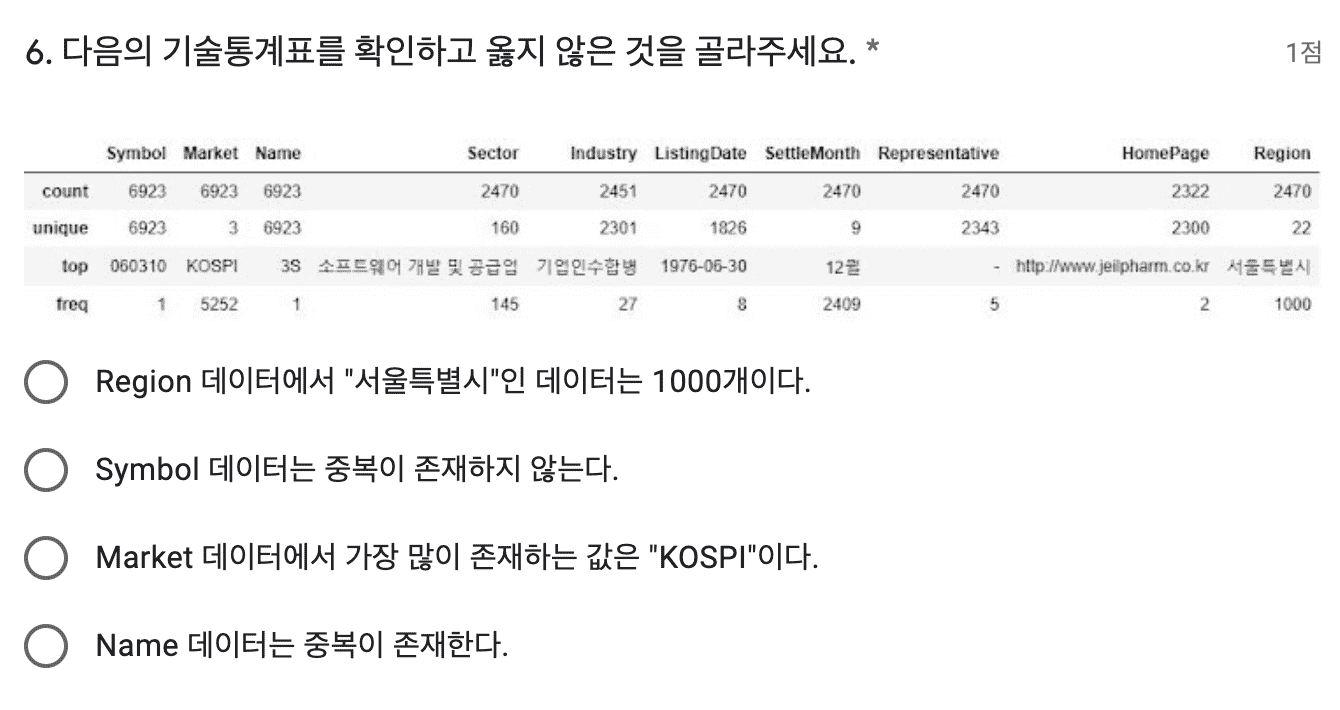
Below is an example problem .