
inflearn logo

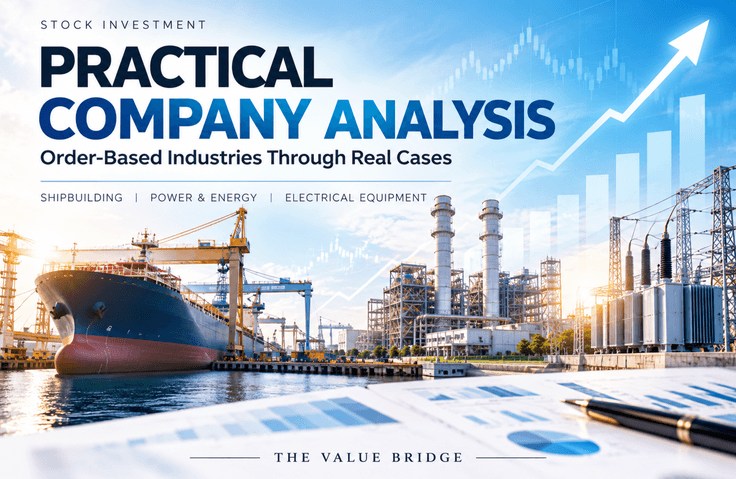
Practical Corporate Analysis for Stock Investment: Learning How to Analyze Order-Based Industries Through HD Hyundai Heavy Industries, Doosan Enerbility, and HD Hyundai Electric

Will performance improve going forward as new orders increase and the order backlog accumulates? Is an increase in contract assets and contract liabilities a positive sign? And when will the orders received now show up as revenue and profit? Even if you have studied financial statements, you may often find yourself stuck when analyzing an actual company, unsure how to connect the current numbers to future performance. For more than 15 years, I have analyzed numerous companies across various industries in corporate finance and credit evaluation. In the process of assessing companies’ business structures and financial risks, I have learned that it is more important to track how changes in a business flow through to the numbers in its financial statements than simply to calculate financial ratios. Based on this experience, this course analyzes the business reports and financial statements of actual companies, including HD Hyundai Heavy Industries, Doosan Enerbility, and HD Hyundai Electric. We will connect changes in new orders and order backlogs, contract assets and contract liabilities, production lead times, ship prices and costs, operating profit margins, and cash flows to trace step by step how orders are converted into actual results. Through case studies of construction companies, we will also examine the reliability of recognized revenue and profit by analyzing contract assets, estimated costs, cost ratios, and cash flows. The important thing is not to memorize any single indicator like a formula. Even the same contract liability multiple can have a different meaning depending on a company’s business structure and production lead time, and even if the order backlog increases, whether this leads to an actual improvement in profitability must be verified separately. Therefore, in this course, through real-world case studies, you will learn which numbers to examine first for each company, what to review alongside them, and how to verify whether those changes actually lead to revenue and profit. By the end of the course, the goal is for you to move beyond simply confirming that “new orders have increased” or “contract liabilities have risen.” Instead, you will develop a framework for analyzing companies that enables you to independently assess and verify the direction of future performance from current numbers by following the flow of work → revenue → profit → cash.

1 learners are taking this course

Level Intermediate

Course period 6 months

Accounting
Accounting
Financial Management

Financial Technology
Investment
Investment
Accounting
Accounting
Financial Management
Financial Technology
Investment
Investment

What you will gain after the course

  • 1. The ability to assess the future performance of order-based industries: By analyzing changes in new orders and order backlog, you can determine whether a company’s workload is increasing and whether it is likely to translate into future revenue.

  • 2. Ability to use contract assets and contract liabilities in actual company analysis: Rather than simply comparing changes and multiples of contract assets and contract liabilities, you can analyze their absolute amounts alongside production lead times to interpret the process and time lag by which orders are converted into revenue and profit.

  • 3. The ability to verify whether increased orders are actually leading to improved profitability: By connecting not only orders and revenue, but also ship prices, costs, cost ratios, and operating profit margins, you can distinguish between “having more work” and “having more work that will generate good profits.” In the case of HD Hyundai Heavy Industries, improved performance resulted not simply from an increase in orders, but from the combined effects of working through low-priced orders, recognizing revenue from high-priced orders, increased production and absorption of fixed costs, and the vessel-type mix.

  • 4. A Corporate Analysis Framework for Finding Clues to Future Performance in Business Reports: When analyzing an actual company, you will know what to check in the order of “workload → revenue → profit → cash,” and be able to analyze the company independently by connecting orders received, contract assets, contract liabilities, profitability, and cash flow.

We look at numbers that move before the results appear in the financial statements.

In this course, we track the following flow using business reports and financial statements.

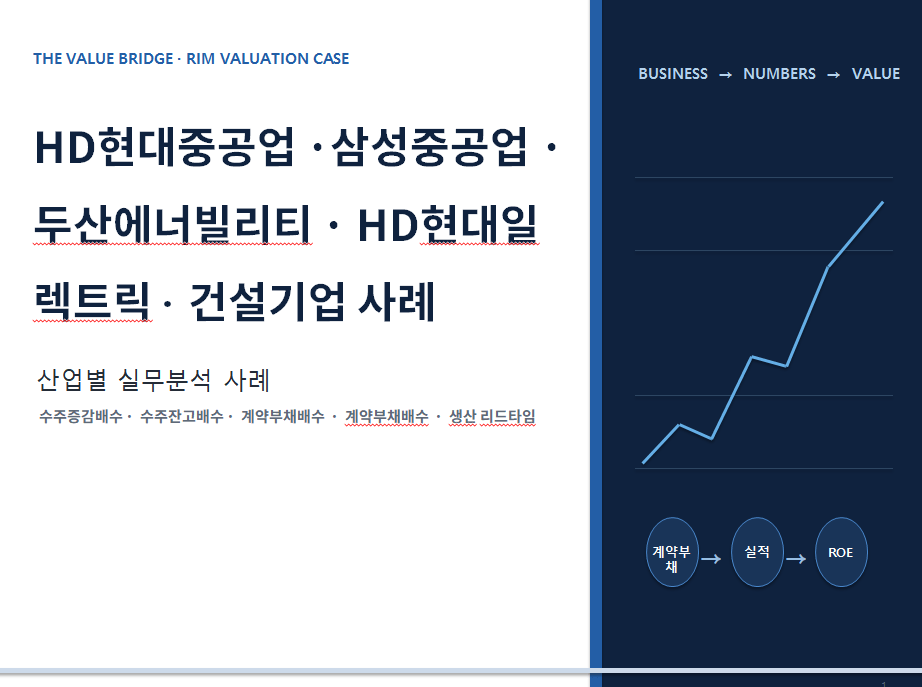
New orders → order backlog → contract assets and contract liabilities → revenue → profit → cash

It doesn’t end with how much new business has been won.

We trace it through to when that work turns into revenue, what profitability it generates, and whether it is ultimately collected as cash.

For this, I find and analyze changes in orders and order backlogs, contract assets and contract liabilities, production lead times, selling prices and costs, operating profit margins, and operating cash flow in actual companies’ business reports and financial statements.


It incorporates over 15 years of experience in corporate analysis.

I have analyzed numerous companies across various industries in the field of corporate finance and credit review for more than 15 years.

What I have considered important when analyzing companies is not simply calculating financial ratios,

"Why did this number change?"
"What changes are taking place in the business?"
"How will those changes appear in the financial statements going forward?"

was to verify it.

In this course, drawing on this experience, we explain through examples of actual listed companies how to connect business information in business reports with figures in financial statements to track changes in a company.


📌 Key Teaching Experience

  • Hanyang University, School of Business (Adjunct Professor)

  • Korea Banking Institute (Adjunct Professor)

  • National Pension Fund Management Department

  • Korea Financial Investment Association Financial Investment Education Institute

  • Korea Federation of Savings Banks

  • Korean Standards Association

  • ※ Numerous B2B and group training sessions conducted primarily for financial institutions, pension funds, and associations


We analyze real companies.

HD Hyundai Heavy Industries | The Time Lag Between Orders and Performance

By examining contract liabilities and orders, vessel prices and costs, and production lead times together, we analyze the process and time lag involved in orders turning into actual results. We also examine how factors such as the completion of low-priced orders, revenue recognition from high-priced orders, increased production and fixed-cost absorption, and vessel mix affect profitability—not just the increase in orders.


Doosan Enerbility | Inflow and Accumulation of New Work

Through the flow of changes in orders → order backlog → operating profit margin, we analyze how much new work is coming in and accumulating, and whether that work is actually translating into profitability.

We also verify using actual figures why future profits should not be taken for granted simply because the order backlog is large.


HD Hyundai Electric | From Order Backlog to Profitability

We analyze not only order backlogs and contract liabilities but also order prices, production capacity, pricing power, and operating profit margins.

We examine not just whether the contract liability multiple is rising or falling, but what is causing the change and how it is translating into actual profitability.


Construction Companies | From Contract Assets to Cash Flow

In the construction industry, we connect contract assets with the progress of work, estimated costs, cost ratios, billing and collections, and cash flow.

Through real-world cases, we analyze whether an increase in contract assets reflects a normal timing difference in the progress of work or a warning sign arising from cost estimates or the billing and collection process.


The same number can mean different things depending on the company.

In this course, we do not use a single metric as a one-size-fits-all formula.

Even the same contract liability multiple can have different meanings depending on a company’s business structure and production lead time. An increase in the order backlog may not lead to improved profitability if order prices and the cost structure are unfavorable. Therefore, for each company, it is important to know which numbers to look at first, what to examine alongside those numbers, and how to verify whether they are translating into actual results.

This is what makes this course different from a simple financial ratio course.


Ultimately, we analyze the company through four questions.

The analytical criteria running throughout the entire course are clear.

① Is new work coming in?
Check new orders, changes in order intake, and the order backlog.

② When does that work become revenue?
We examine the production lead time, contract period, construction progress, and contract assets and liabilities.

③ Does it generate a real profit when converted into revenue?
Check the order price and costs, cost of sales ratio, operating profit margin, and more.

④ Is that profit collected in cash?
We examine billings, accounts receivable, operating cash flow, and more.


From Checking Numbers to Reading the Flow of Numbers

The goal of this course is not to predict the stock price of a particular company or determine whether to invest based on a single indicator.

After completing the course, when you review order announcements, you will not stop at simply saying "orders have increased",

How much new work has come in?
→ When will it be converted into revenue?
→ What level of profitability will it generate?
→ Is it actually being collected as cash?

You should be able to verify it for yourself.

Reading a business report’s “work pipeline” by connecting it to “profit and cash” in the financial statements.

Through this course, we encourage you to develop a framework for analyzing order-based companies that enables you to independently assess and verify the direction of future performance based on current figures.

Recommended for
these people

Who is this course right for?

  • 1. Investors who see news that orders have increased but find it difficult to determine whether performance will improve going forward

  • 2. Investors unsure how to use order backlog, contract assets, and contract liabilities in investment analysis

  • 3. Investors who can read financial statements but have difficulty connecting current figures to future performance

  • 4. Investors who want to develop their own criteria for analyzing real companies beyond simple financial ratios

Hello
This is The Value Bridge

Career Verified

15

Learners

4

Reviews

5.0

Rating

3

Courses

A corporate finance expert who has worked for more than 15 years as a corporate banking credit analyst at banks, conducting thousands of corporate analyses covering large and mid-sized companies, acquisition financing, and more. His strength lies in reading a company’s risks, structure, and industry characteristics through the numbers revealed in its financial statements.

After earning a Ph.D. from Hanyang University, he has taught students as a professor while pursuing academic research and practical education. He has also lectured on corporate credit analysis, industry-specific financial analysis, and corporate valuation at KB Kookmin Bank, Shinhan Bank, IBK Industrial Bank of Korea, Woori Bank, as well as securities firms, pension funds, and the Korea Banking Institute.

“Financial Statements Analyzed Across 11 Industries: Decoding Accounting Items and Investment Decisions Through Numbers” is a book that reconstructs financial statements into analytical tools that can be directly applied to investments and decision-making, based on recurring questions from the financial sector and real-world corporate cases.

I regularly write about financial statements and corporate valuation.
Naver blog The Value Bridge – A bridge connecting numbers and value (blog.naver.com/thevaluebridge)

More

Curriculum

All

4 lectures ∙ (1hr 39min)

Course Materials:

Lecture resources
Published: 
Last updated: 

Reviews

Not enough reviews.
Please write a valuable review that helps everyone!

The Value Bridge's other courses

Check out other courses by the instructor!

Similar courses

Explore other courses in the same field!

Limited time deal

$35,750.00

35%

$42.90