
inflearn logo

Financial Statement Analysis by Industry for Stock Investing: Reading Business Structure and Profitability Through Numbers

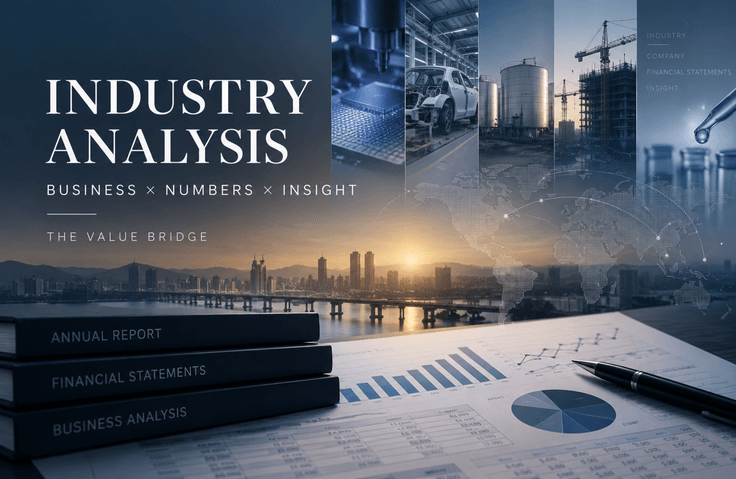
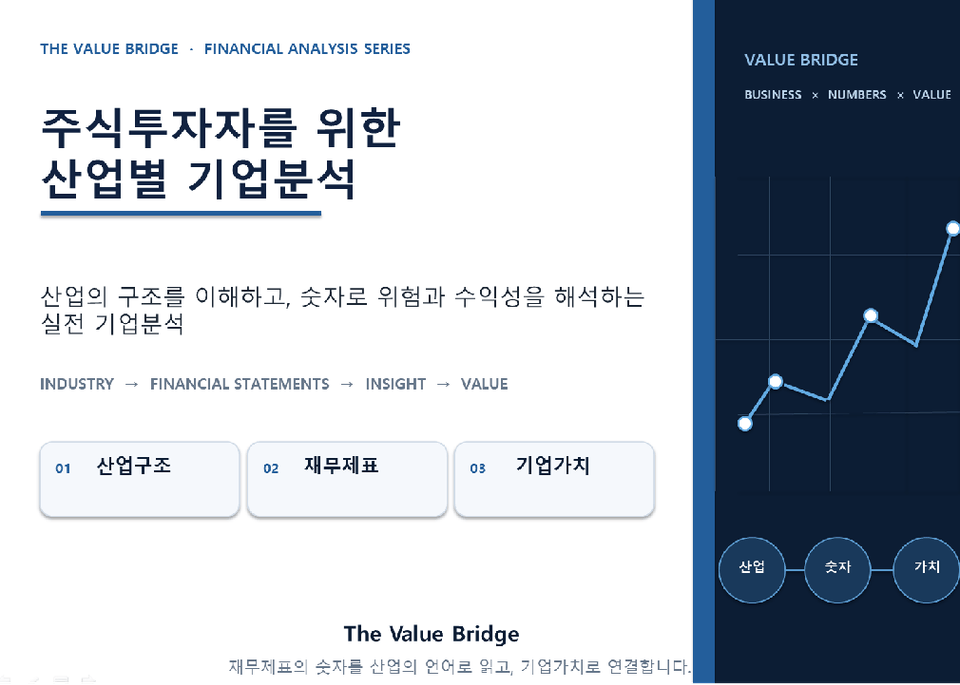
Have you ever found it difficult to know which numbers to look at first when reviewing financial statements and business reports, or to interpret why revenue and profit have changed? For more than 15 years, I have analyzed companies across a wide range of industries in the corporate finance field, and I have learned that even when looking at the same financial statements, the numbers that matter most differ depending on the industry and business model. Corporate analysis is not simply about calculating financial ratios; it is the process of understanding what a company sells to make money, what costs it bears, and how industry risks appear in the numbers. This course begins with finding the information needed for analysis in the “Business Overview” section of a business report and in the notes to the financial statements. We examine the causes of growth by breaking revenue down into selling price (P) × sales volume (Q), and assess pricing power and bargaining power by comparing raw material prices with product prices. We then classify key costs into fixed and variable costs and connect CAPEX, depreciation, capacity utilization, and cost ratios to analyze how a company’s profitability and risks differ. We also examine what needs to be reviewed differently in business reports across industries such as manufacturing, food, semiconductors, secondary batteries, shipbuilding, construction, pharmaceuticals and biotechnology, and rentals. Through real-world company examples, you will learn how to connect numbers with business structures. The goal of this course is not to memorize the many numbers in a business report. It is to learn the flow of analysis—from industry and business structure → revenue structure → cost structure → profitability and risk—and establish a framework for analyzing companies independently.

1 learners are taking this course

Level Basic

Course period 6 months

Accounting
Accounting
Investment
Investment
Financial Management
Monetization
Monetization
Accounting
Accounting
Investment
Investment
Financial Management
Monetization
Monetization

What you will gain after the course

  • You can independently find the information needed for company analysis in business reports: You can find and analyze information needed for company analysis—such as business segments, sales by product, raw material prices, selling prices, production facilities and utilization rates, orders, R&D, and key expenses—in the “Business Overview” section of DART business reports and the notes to the financial statements.

  • You can assess the causes of sales growth by breaking them down into price (P) and quantity sold (Q). Rather than looking only at the result that sales have increased, you can distinguish between price increases, higher sales volume, and foreign exchange effects, and compare product prices with raw material prices to interpret the causes of changes in pricing power, bargaining power, and profitability.

  • By analyzing a company’s cost structure, you can determine which variables its profits are sensitive to. Identify key costs such as raw materials, labor, depreciation, and outsourced processing, classify them as fixed or variable costs, and link cost ratios, CAPEX, depreciation, and capacity utilization to analyze how changes in sales affect profits and assess the company’s earnings sensitivity.

  • You can determine for yourself “what to look at” based on the industry and business model: Rather than applying the same financial ratios to every company, you can analyze companies by connecting the business risks specific to each industry—such as manufacturing, food, semiconductors, secondary batteries, shipbuilding, construction, pharmaceuticals, biotech, and rentals—to the financial statement items and key metrics in which they are reflected.

You’ve checked the numbers in the financial statements, but can you explain why they changed?


Corporate analysis does not end with simply checking changes in revenue and operating profit or calculating financial ratios. You also need to understand what the company sells in which industry to make money, what its cost structure is, and how the risks of the industry and business are reflected in the financial statement figures.


With over 15 years of experience analyzing various industries and companies in corporate finance, I have learned that even with the same financial statements, the numbers that matter most can vary depending on the industry and business model. In this course, drawing on that practical experience, we will cover how to interpret the numbers in business reports and financial statements by connecting them to the actual business structures of companies.


First, we examine what to look for in the ‘Business Overview’ section of DART business reports and the notes to the financial statements. You will learn how to find the information needed for corporate analysis, including revenue by business segment and product, raw materials and selling prices, production facilities and utilization rates, orders, research and development, and key costs.


Next, we break down revenue into selling price (P) × sales volume (Q). When revenue increases, we distinguish whether it was due to higher prices, increased sales volume, exchange rates, or one-off factors. We then examine changes in raw material and product prices together to analyze pricing power and bargaining power. We also explore the differences between Supply Chain companies and Market Supply companies through real-world examples.


Next, you will identify the company's key costs, classify them as fixed and variable costs, and analyze them in connection with CAPEX, depreciation, capacity utilization, and cost ratios. You will learn why expansion leads to future fixed-cost burdens, how changes in capacity utilization affect profitability, and which costs and indicators to focus on by industry.


We also examine how business risks in industries such as semiconductors, secondary batteries, food, shipbuilding, construction, pharmaceuticals and biotechnology, and rentals appear in specific financial statement items and key indicators. An important goal of this course is to learn how to adjust the focus of your analysis according to the industry and business model, rather than applying the same analytical criteria to every company.


The goal of this course is not to memorize numerous financial statement figures and formulas.

It is about understanding the analytical flow from industry and business structure → revenue structure → cost structure → profitability and risk and developing a framework for corporate analysis that enables you to independently explain, when looking at the figures in a business report, “why has this figure changed, and what does this mean for the company’s business and profitability?”

Recommended for
these people

Who is this course right for?

  • Those who feel overwhelmed and don’t know where or what to look at when they open a business report

  • Investors who can see the numbers in financial statements but struggle to explain “why they changed”

  • Those who want to analyze the actual business risks and profitability of a company beyond financial ratio analysis

  • Those who want to know how to analyze companies differently depending on the industry.

Need to know before starting?

  • No prior knowledge is required.

  • Even without experience in company analysis, you can learn by following the course’s analysis sequence.

Hello
This is The Value Bridge

Career Verified

10

Learners

3

Reviews

5.0

Rating

2

Courses

He is a corporate finance expert who has worked as a corporate finance analyst at banks for over 15 years, conducting thousands of corporate analyses covering large enterprises, mid-sized companies, acquisition financing, and more. His strength lies in reading a company’s risks, structure, and industry characteristics through the figures revealed in its financial statements.

After earning a Ph.D. from Hanyang University, he has taught students as a professor while pursuing academic research and practical education. He has also lectured on corporate credit analysis, industry-specific financial analysis, and corporate valuation at securities firms, pension funds, the Korea Banking Institute, and other institutions, including KB Kookmin Bank, Shinhan Bank, IBK Industrial Bank of Korea, and Woori Bank.

“Financial Statement Analysis Across 11 Industries: Decoding Accounting Accounts and Investment Decisions Through Numbers” is a book that reconstructs financial statements as analytical tools directly applicable to investment and decision-making, based on recurring questions from the financial industry and real-world corporate cases.

I regularly write about financial statements and corporate valuation.
Naver blog: The Value Bridge – A bridge connecting numbers and value (blog.naver.com/thevaluebridge)

More

Curriculum

All

4 lectures ∙ (1hr 25min)

Course Materials:

Lecture resources
Published: 
Last updated: 

Reviews

Not enough reviews.
Please write a valuable review that helps everyone!

The Value Bridge's other courses

Check out other courses by the instructor!

Similar courses

Explore other courses in the same field!

Limited time deal

$23.10

32%

$34.10