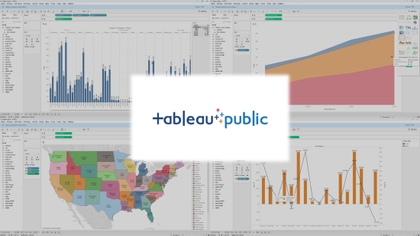
Data Visualization with Tableau: From Installation to Compelling Dashboard Reporting

Even complex data becomes clear at a glance with Tableau! From a single drag to a finished dashboard, master data visualization for real-world business.

1 learners are taking this course

Level Beginner

Course period Unlimited

Tableau
Tableau
Big Data
Big Data
Chart Analysis
Chart Analysis
Excel
Excel
Tableau
Tableau
Big Data
Big Data
Chart Analysis
Chart Analysis
Excel
Excel

What you will gain after the course

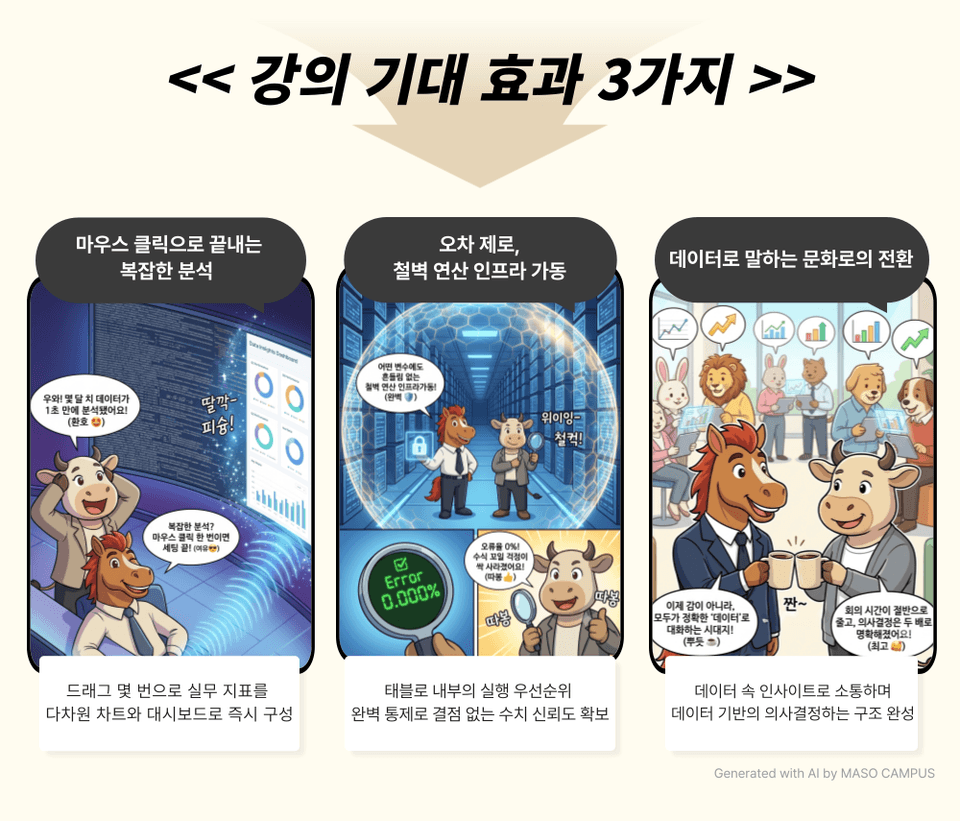
  • Configure an analyzable dataset by connecting multiple files and tables

  • Express key metrics as intuitive charts using dimensions, measures, and marks.

  • Immediately derive next quarter's demand forecast results with a single application of the time-series forecasting model.

  • Exploring data distribution and segments through clustering and map visualization

Visualization is not something that can only be done through difficult coding.
'Tableau Visualization Analysis' implements high-end statistics with just a mouse drag!

“The moment data trapped in tables becomes charts and dashboards, decision-making becomes much faster.”
It starts with a single mouse click and ends with a complete design.


– Connect multiple files and tables to configure analysis-ready datasets
– Express key metrics as intuitive charts using dimensions, measures, and marks
– Instantly derive next-quarter demand forecasts by applying a time-series forecasting model once
– Explore data distribution and segments with clustering and map visualization

Today is the last day your analysis work will be tied to Excel and manual aggregation.
Stop chasing data and become the 'architect' who completes the analysis system.

What is Tableau?

Tableau is the world's No. 1 business intelligence (BI) and data visualization tool,
a solution that allows anyone to build intuitive dashboards using only drag-and-drop without complex coding or development knowledge.
While traditional spreadsheets slow down when analyzing large amounts of data and require writing complex functions,
Tableau processes vast amounts of data quickly and easily connects various data sources.
Through interactive dashboards, you can identify hidden patterns and insights at a glance, supporting data-driven decision-making across planning, marketing, and management.

Stop wasting time on data analysis struggling with Excel formulas!
Complete your data mastery as a top 1% professional with Tableau!


Data Visualization Curriculum Features: Mastering Everything with Tableau

This is a practical course that goes beyond just creating charts to complete a structure where data speaks for itself.

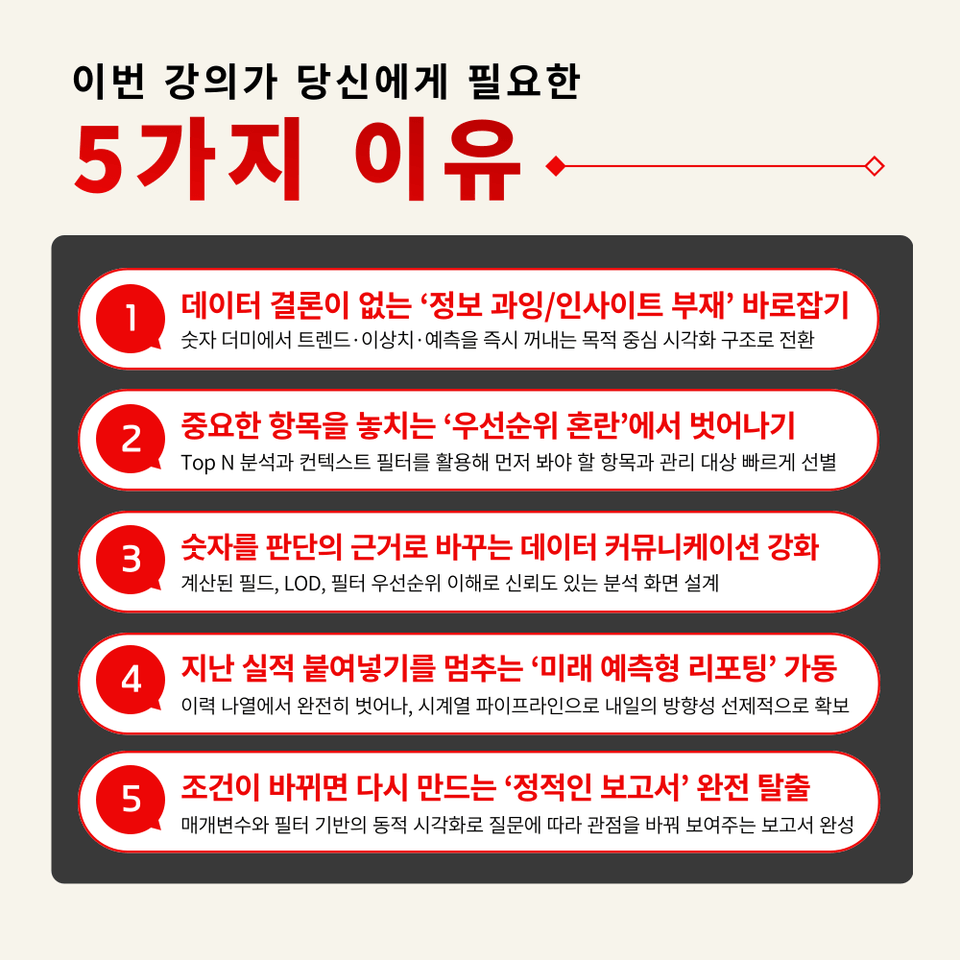
1. 'Data Preparation and Connection' to establish the starting point of analysis
Complete an integrated dataset that eliminates analysis preparation time by merging multiple files, sheets, and tables through Union and Join

2. 'Visualization Principles Design' that shows context
Learn the operating principles of dimensions, measures, and mark cards to directly design and configure charts that fit data characteristics

3. ‘Advanced Analytics Design’ to Capture Signals within Data
Complete your analytical capabilities by directly implementing outliers, correlations, time-series forecasting, and clustering with real-world data

4. 'Calculation & Filter Structure' that processes without errors even when conditions change
Establish a system that accurately and automatically handles complex analytical conditions by understanding LOD, aggregate calculations, and filter precedence

5. ‘Dynamic Interaction’ for Real-time Communication with Users
Building a responsive reporting environment that answers decision-makers instantly upon clicking filters, using parameters and context filters


Tableau goes beyond being just a tool for making data look good.

Connect scattered data to provide meaningful flow and practical, business-oriented analysis.

A 3-step practical course to rising as a designer who commands data

1. Register for the Course

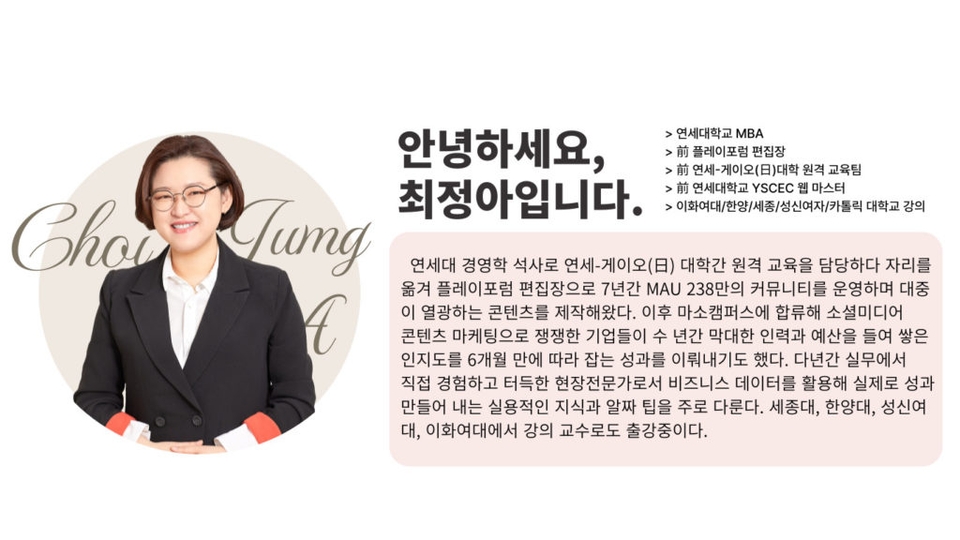
2. Master 'Dimensions, LOD, Filters, and Dynamic Visualization' with Tableau alongside Instructor Jung-ah Choi

3. Complete 'practical visualization design capabilities' that handle complex analytical conditions without errors

Now, Tableau has gone beyond being just a graphing tool,

It is a data weapon that illuminates business insights!

Tableau handles the collection.
The mouse handles the visualization. The insight is all yours.


If you never had time to actually look for insights because you were busy organizing the same tables and redrawing charts every time?

Spend less time organizing numbers and focus on the insights within the data!

We confidently recommend this to the following people.

– Data beginners who know Tableau is good but don't know where to start
– Professionals tired of repetitive Excel formula errors and chart revisions who need a better tool
– Marketing, sales, planning, and operations managers who want to increase the persuasiveness of their reports
– Business practitioners who want to develop data-driven decision-making capabilities
– Non-data majors who want to personally implement time-series forecasting and clustering without coding

Many people create charts, but those who design visualization structures are different.
Breathe life into your data with Tableau and discover hidden insights quickly!


Course Features

STEP 1. Moving from an 'Unfamiliar Screen' to a 'Data Analysis Environment'

From identifying product lines to installing Public and connecting data, perfectly prepare the environment before starting analysis

STEP 2. Transition from 'Numerical Tables' to 'At-a-Glance Charts'

Principles of dimensions, measures, and mark cards + building your own bar charts, line charts, highlight tables, and dashboards

STEP 3. Utilizing 'Practical Analysis Functions' to Find Hidden Problems and Opportunities

Discover signals invisible through numbers alone using box plots, IQR, trend lines, clustering, and map visualization

STEP 4. Time-series forecasting to read everything from 'past data' to 'future trends'

Identify data trends over time and expand into recurring patterns and future directions using forecasting features

STEP 5. Completing Interactive Charts that React to Mouse Clicks in Real-Time

Build interactive charts to explore data by changing conditions using filters and parameters

 If you are only looking at data in tables, you are missing out on half of the insights.

Tableau transforms key metrics into charts and dashboards with just a simple drag-and-drop.

People who are good at presenting data have a different way of reporting.
Reduce the time spent creating charts and focus on discovering insights!


Anticipated Q&A

Q. Can beginners who are new to Tableau or data analysis also take this course?
A. Yes, it is possible. This course is designed to learn basic concepts step-by-step, starting from installing Tableau Desktop Public to data connection, screen configuration, dimensions and measures, and utilizing mark cards. Since you will learn through practice—such as creating charts and configuring dashboards—without the need for complex coding or statistical knowledge, even first-timers can easily follow along.

Q. Can I take the course even if I don't have the paid version of Tableau?
A. Yes, you can follow the hands-on exercises perfectly with the free version. The beginning of the course includes steps to install Tableau Desktop Public and set up the environment together, so you can comfortably start learning with the free edition without paying for a separate subscription.

Q. Can I apply what I learn in the lecture directly to my actual work?
A. Yes, this course is designed with practical application in mind. The practice sessions are based on core patterns used directly in real business fields, such as 'Top N Analysis', 'K-means Automatic Clustering', and 'Time Series Forecasting', so you can apply them to your actual work immediately.


Please check before taking the course!

  • Since this is a practice-oriented course, we recommend using dual monitors or an extra device so you can separate the lecture screen from your practice screen.

  • Additionally, as the practice sessions are based on Windows OS, we recommend taking the course in a Windows environment.

  • Lecture materials and practice files are available in the <00. Textbook Download Center> section.


Recommended for
these people

Who is this course right for?

  • Data beginners who know Tableau is good but don't know where to start

  • Office workers who are tired of repeating Excel formula errors and chart revisions and need a better tool

  • Marketing, sales, planning, and operations professionals who want to make their reports more persuasive

  • Business practitioners who want to develop data-driven decision-making capabilities

  • Non-data professionals who want to personally implement everything from time-series forecasting to clustering without coding.

Need to know before starting?

  • This course is designed to help you learn basic concepts step-by-step, starting from installing Tableau Desktop Public to data connection, screen configuration, dimensions and measures, and utilizing mark cards. Since you will learn through hands-on practice—including chart creation and dashboard construction—without the need for complex coding or statistical knowledge, even beginners can easily follow along.

  • You can follow along with the practice sessions perfectly using the free version of Tableau. The beginning of the course includes steps to install Tableau Desktop Public and set up the environment, so you can comfortably start learning with the free edition without paying for a separate subscription plan.

  • The training is conducted based on core patterns used directly in actual business fields, such as 'Top N Analysis', 'K-means Automatic Clustering', and 'Time Series Forecasting Analysis', allowing for immediate application to real-world tasks.

Hello
This is Masocampus

12,481

Learners

1,870

Reviews

149

Answers

4.7

Rating

118

Courses

"I will grow more than yesterday. And, I will help those who strive to grow more than yesterday."

With Actionable Content that embodies the sincerity and aspirations of Maso Campus,

100 million cumulative hours of lectures shared online and offline since 2013!

This precious experience and time are always the source of growth for both Maso Campus and our students.

The Miso Campus team strictly adheres to two principles for the growth of us all. 1. Actionable Content that can be put into practice immediately after learning. 2. Respecting the time and effort of participants.

The Miso Campus team strictly adheres to two principles for the growth of us all.

1. Actionable Content that you can actually use after learning 2. Time-Saving Curriculum that respects the participant's time and effort Grow with Miso Campus's Actionable and Time-Saving Curriculum

1. Actionable Content that you can surely use once you learn it

2. Time-Saving Curriculum that respects the time and effort of participants

We hope you will walk the path of growth together with Masocampus's Actionable and Time-Saving Curriculum.

We hope you will walk the path of growth together with Maso Campus's Actionable and Time-Saving Curriculum.

More

Curriculum

All

38 lectures ∙ (14hr 33min)

Course Materials:

Lecture resources
Published: 
Last updated: 

Reviews

Not enough reviews.
Please write a valuable review that helps everyone!

Masocampus's other courses

Check out other courses by the instructor!

Similar courses

Explore other courses in the same field!

Limited time deal

$49.50

28%

$69.30