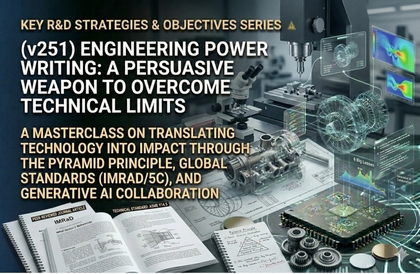
['Thought Architect' Roadmap for Translating Technical Truth into Business Value]
1. Introduction: Analysis of Constraints in Transferring Technical Truth to Business Value
A significant bottleneck frequently observed across corporate sectors and engineering sites (R&D) is the phenomenon where innovative achievements, backed by massive resources and research capabilities, are discarded because they fail to overcome the 'communication threshold.' This is judged to stem from information asymmetry: a situation where management does not sufficiently perceive the depth of deep-tech, and technical personnel fail to appropriately utilize business language.
This masterclass redefines the 'text-based communication competency' of engineers and scientists not as a mere administrative act of recording, but as part of a precise 'Engineering Design' process. Through this, we aim to present a mechanism by which an engineer's technical insights are transformed beyond simple records into core assets that drive the organization's strategic decision-making.
2. [Diagnosis] Analysis of Three Major Cognitive Defects Hindering Technical Communication
① Disconnection of Information Transfer due to the Curse of Knowledge
This phenomenon occurs when experts become immersed in their own advanced level of knowledge and overlook the cognitive background of the information recipient. Consequently, reports centered on obscure formulas and technical acronyms are repeated, which is highly likely to result in structural losses such as loss of contact with decision-makers, delays in project approval, and failure in resource allocation.
② Value Loss due to Lack of Logical Architecture and Data Fragmentation
By regarding document preparation as a simple post-hoc administrative procedure, errors of listing information without systematic design are frequently observed. These structural defects significantly damage the value of R&D achievements during the delivery process, tending to lead not only to the undervaluation of an individual engineer's capabilities but also to the loss of tangible and intangible assets for the entire organization.
③ Technical Reliability Crisis due to Deepening AI Dependency
If generative AI, introduced to improve productivity, causes hallucinations without understanding the technical context, 'technical reliability'—the core value of engineering—can be seriously undermined. Utilizing AI without an accompanying logical verification system is highly likely to act as a potential system risk rather than a work efficiency tool.
3. [Prescription] Strategic Communication System for the Thought Architect
① Engineering Design of Thought for Unstructured Information
A process of structuring abstract experimental data and hypotheses based on engineering system design principles is required.
Bottom Line Up Front (BLUF): By placing core values and recommendations at the forefront of the document, we aim for an information structure optimized so that management can perform rapid and accurate decision-making (capital investment, mass production approval, etc.).
Mutually Exclusive, Collectively Exhaustive (MECE): By adhering to principles that prevent logical overlap and omission, we ensure the logical completeness of the report by designing a seamless flow of thought.
② Global Standard Compliance and Quality Assurance
Objectivity and integrity of data must be secured by internalizing standard protocols recognized by the global scientific community and global corporations.
Standard Technical Reporting Structure (IMRaD): Maintain the consistency and reliability of the engineering narrative through a rigorous formal structure leading from Introduction, Methods, Results, to Discussion.
5 Principles of Sentence Quality (5C): By applying Correctness, Clarity, Conciseness, Consistency, and Completeness as quality control filters, we establish a Plain Language system that even non-experts can understand immediately.
③ S.E.E.D Prompt Architecture for Securing AI Command
To operate AI not as a simple ghostwriting tool but as an assistant performing logical operations, a dedicated interface design must be involved.
S.E.E.D Framework: Precisely control the quality of AI outputs by systematically structuring and inputting Situation, Expectation, Engineering Structure, and Data.
Human-in-the-Loop: Establish a protocol where humans perform verification as the final approver to block the possibility of AI errors, thereby firmly maintaining technical authority.
4. [Execution] Strategies for Securing Cognitive Sovereignty and Workflow Optimization
Communication competency acts as a core mechanism for preserving an engineer's cognitive functions beyond mere technical means.
Responsibility-based Sandwich Workflow: Humans must perform context design (Top Bun) and final verification (Bottom Bun), delegating only the intermediate data processing (Meat) stage to AI to promote the activation of the human-unique Executive Control Network (ECN).
RQTDW Learning Protocol for Knowledge Internalization: Apply the five stages of Read, Question, Think (facing contradictions), Discuss (virtual discussion), and Write to practical work to avoid simple acceptance of information and actively internalize knowledge.
SIFT Model-based Precision Fact-Checking: Filter AI hallucinations and maintain technical precision through the process of Source (checking the origin), Investigate (understanding context), Find (cross-checking), and Trace.
5. Conclusion: Transition from Technical Expert to Engineering Leader
The era of practitioners who simply perform given technical tasks is coming to an end. The ability to translate and communicate complex and difficult technical truths into a 'language of value' acceptable to organizations and society can be defined as a core survival strategy and a noble calling for modern engineers.
Text communication is the Final Interface that projects an engineer's intellectual capacity to the outside world, beyond a simple act of recording. Through this masterclass, we expect you to prove your technical value and emerge as a powerful 'Engineering Leader' who drives organizational change. This system, which integrates 40 years of engineering insight, will become a strategic asset that completes your status as a professional.


![[2026 AI Trends] A Completely Different Generative AI: How Individuals and Corporations Will Coexist with AICourse Thumbnail](https://cdn.inflearn.com/public/files/courses/341884/cover/ai/2/9c616b32-aa40-411a-8805-b95cb53ba57a.png?w=420)


![[Big Data Learning Center] *Free* 69th & 70th Open House - Bayesian Statistics | Quantification of CategoriesCourse Thumbnail](https://cdn.inflearn.com/public/files/courses/342204/cover/01krzjf3ehn5b2srq8khgk0d6r?w=420)