강의

멘토링

로드맵

Productivity

/

Office

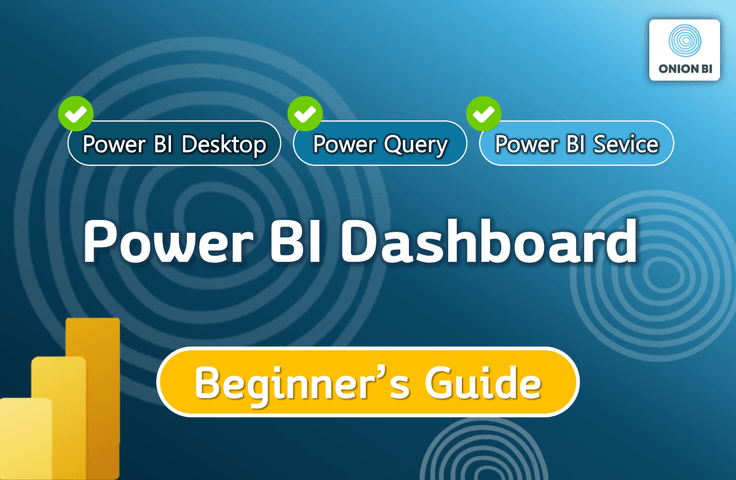
[2024] Power BI Basic Course for Tired Excel Users (Beginner to Intermediate)

Through this course, even beginners can master Power BI from the basics to intermediate level!

(4.9) 7 reviews

59 learners

  • onionbi
데이터분석
데이터-시각화-도구
데이터시각화
Power BI
Excel

What you will learn!

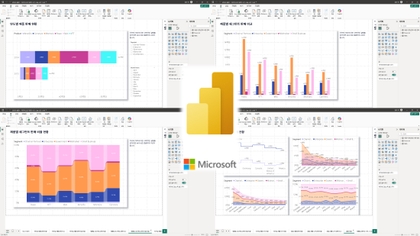
  • How to create data visualizations and reports (dashboards) using Power BI

  • Data preprocessing using the Power Query editor built into Power BI Desktop

  • How to share and refresh reports using the Power BI service

  • How to write the desired calculation formula using basic functions

Class Summary

👉 In this class, you will learn the following! (Total 10 hours of course / 49 lectures, 2024 version)
How to visualize data and create a report (dashboard) using Power BI Desktop
How to easily edit/preprocess data using the Power Query Editor built into Power BI Desktop
How to effectively share my reports with colleagues and keep them fresh/managed using the Power BI service
How to write simple calculations using basic essential functions
How to refresh this entire process with one button

👉 You won't learn this kind of stuff!
Data Modeling
Composing complex DAX function formulas

For those of you who are just starting out with Power BI or have only recently started using it,
Rather than going into in-depth and difficult content, it is structured so that you can systematically build a foundation for Power BI while also understanding the overall functions and workflow. 🤗

It will be a great stepping stone to moving on to intermediate/advanced levels!


People like this will like to hear it.

👉 This basic course was created for these people!
For Power BI beginners or absolute beginners.
People who learned mostly on their own through free courses, etc., but eventually felt the need to learn systematically again.
People who have taken other Power BI online courses a long time ago but still feel unconfident.
For those looking for a solution for simple data visualization and automated dashboards rather than calculations using complex functions.
People who feel frustrated with processing large amounts of data in Excel.
Excel users who are disappointed with the data visualization function.
People who are struggling to create and manage dashboards using Excel.
Those who are looking for an alternative to automation using Excel VBA/Macros.
Those who want to understand the basic concepts and principles of DAX functions and measures/new columns and write formulas.
Those who want to fully utilize the features of Power BI.

👉 People like this, please wait for the advanced course!
Anyone who wants to derive complex measurement calculations through a combination of various DAX functions.
Anyone who wants to perform three-dimensional data analysis by connecting multiple tables from various angles through modeling.
Those who are looking to automate somewhat complex editing tasks using the M language.


The class proceeds like this.

👉 This class is more focused on practical training, as if it were an on-site lecture, rather than theory!
So, we made it at a speed that you can practice at together.
I highly recommend that students download the practice example files in advance and practice editing and visualizing data, implementing dashboards, etc. with me!


Class Notes

📌 A must-read for Mac users!
Power BI Desktop doesn't work on iOS yet!
Therefore, if you are taking the course on a Mac-based PC rather than a Windows-based PC, you must install Windows before taking the course or prepare a Windows-based PC. Even if Windows is installed, please note that additional explanations regarding the keyboard for Mac users will not be provided separately in the course!

Recommended for
these people

Who is this course right for?

  • Power BI beginners or true beginners.

  • If you learned almost everything by yourself through YouTube or free offline courses, but now you think you need to learn it systematically again.

  • If you feel frustrated with the large-scale data processing of Excel.

  • Excel users who are dissatisfied with the data visualization function.

  • If you are looking for an alternative to automation using Excel VBA/macros.

Hello
This is

59

Learners

7

Reviews

5

Answers

4.9

Rating

1

Course

📌 활동사항

Power BI 전문 유튜브 채널 "어니언비아이" 운영자

Power BI 전문 블로그 "Power BI 공방" 운영자

어니언 BI스쿨 운영자

어니언비아이 대표

 📌 강의/컨설팅 경력

 삼성바이오, 한국생명공학연구원, 쿠팡, 코카콜라, 현대홈쇼핑, 매일유업,  DB손해보험, 빙그레, GS리테일, LG유플러스, 한국노바티스, 연세대, 중앙대 등 다수

 패스트캠퍼스 Power BI 전문강사

탈잉 2021 최다판매, 2022 인기강사 Top 8 선정 (최고 리뷰)

 Microsoft 공식 파트너사 소속 Power BI 컨설턴트 양성 강사

📌 BI 대시보드 개발 경력

 오비맥주, 위니아딤채, 써모피셔코리아, LS그룹, 현대백화점, PNS네트웍스, 매일헬스뉴트리션, 바디텍메드, 엑솔타코팅시스템즈, 포르쉐코리아  등 다수

📌 근무 경력

 Microsoft 공식 파트너사 소속 Power BI 시니어 컨설턴트

 글로벌 독일 자동차그룹 V사 경영분석 / 리스크 관리 팀 Head

 글로벌 미국 화학기업 D사 B2B 세일즈마케팅팀

 국내 H자동차 그룹사 본부기획팀

📌 학력

영국 노팅엄대학교 MBA (경영대학원) 졸업

 한양대학교 경제금융학부 졸업

Curriculum

All

50 lectures ∙ (9hr 56min)

Course Materials:

Lecture resources
Published: 
Last updated: 

Reviews

All

7 reviews

4.9

7 reviews

  • 서소현님의 프로필 이미지
    서소현

    Reviews 1

    Average Rating 5.0

    5

    100% enrolled

    • moonis79님의 프로필 이미지
      moonis79

      Reviews 2

      Average Rating 5.0

      5

      30% enrolled

      • 김진태님의 프로필 이미지
        김진태

        Reviews 2

        Average Rating 5.0

        5

        60% enrolled

        • 박종성님의 프로필 이미지
          박종성

          Reviews 1

          Average Rating 5.0

          5

          30% enrolled

          친절한 설명 너무 좋습니다.

          • 이강호님의 프로필 이미지
            이강호

            Reviews 2

            Average Rating 5.0

            5

            30% enrolled

            $102.30

            Similar courses

            Explore other courses in the same field!