![[D-PEC UP_PASS] Nationally Certified Industrial Security Expert (ISE)Course Thumbnail](https://cdn.inflearn.com/public/files/courses/333129/cover/ai/0/67228f11-355f-4e72-86c5-4c7d1b906a63.png?w=420)
[D-PEC UP_PASS] Nationally Certified Industrial Security Expert (ISE)
sdj0831
$102.30
24%
$77.00
Beginner / Penetration Testing, security, security training, Industrial Security Exper
4.2
(12)
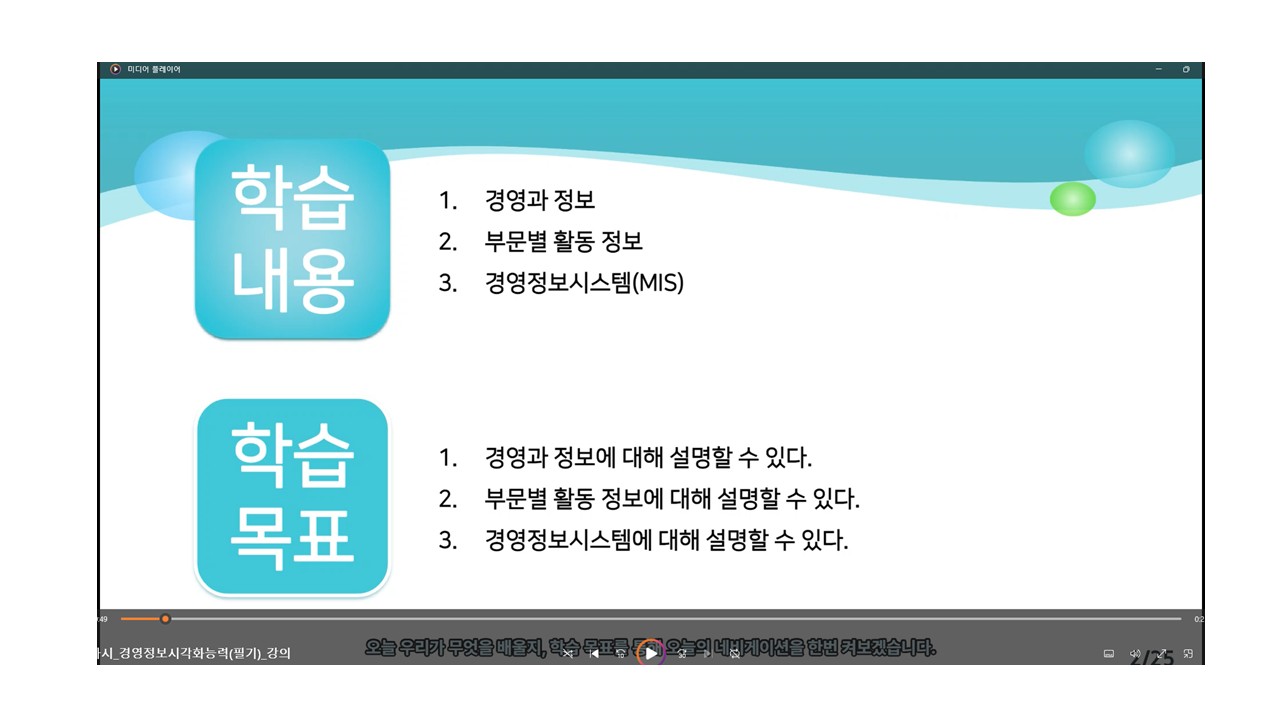
"Nationally Certified Industrial Security Manager" New Renewal Version Final Update Completed!! This course is designed to help you obtain the Nationally Certified Industrial Security Manager certification by providing a systematic understanding of industrial security from a management perspective. Rather than focusing on rote memorization, the content is structured so that even non-security majors can understand the concepts, structure, and flow of industrial security. It is designed not only for exam preparation but also for practical application and career expansion.
Beginner
Penetration Testing, security, security training
![[Deep-Up_ONE] Understanding Corporate IT Systems in One GoCourse Thumbnail](https://cdn.inflearn.com/public/files/courses/341417/cover/ai/2/bfab075d-63e3-4b79-a37b-000e4e1d1549.png?w=420)
![[Deep-Up_ONE] Understanding IT terms and structures used at work in one goCourse Thumbnail](https://cdn.inflearn.com/public/files/courses/340697/cover/ai/3/d18ecd4f-01df-4ddf-8b45-7a471ff7d7f3.png?w=420)
![[Deep-Up_PASS] AWS Certified AI Practitioner Exam Question ExplanationsCourse Thumbnail](https://cdn.inflearn.com/public/files/courses/337055/cover/01jxh5hzmh89eztnpmr0hbssfz?w=420)
![[D-PEC UP_PASS] Test of Information Security (TOLIS)Course Thumbnail](https://cdn.inflearn.com/public/files/courses/335790/cover/01k1fkg3ge5sb67f0xdtesh791?w=420)
![[D-PEC UP_PASS] Data Architecture Semi-Professional (DAsP)_New Renewal CompletedCourse Thumbnail](https://cdn.inflearn.com/public/files/courses/333571/cover/ai/2/1a2dc349-c7f4-46e7-b0dd-d977c0dc4a0b.png?w=420)
![[D-PEC UP_PASS] National Certified Advanced Data Analytics Semi-Professional (ADsP)Course Thumbnail](https://cdn.inflearn.com/public/files/courses/333494/cover/ai/2/64dbe720-a967-474d-bda2-8aad9d5fb88b.png?w=420)
![[D-PEC UP_PASS] IoT (Internet of Things) Knowledge Proficiency TestCourse Thumbnail](https://cdn.inflearn.com/public/files/courses/333144/cover/ai/0/a3563401-5605-4225-bc12-d3c45780bad5.png?w=420)
![[2025 Revised Edition] Big Data Analysis Certification Practical Exam (with Python)Course Thumbnail](https://cdn.inflearn.com/public/files/courses/328825/cover/01jqd5b85mx0ydbamfrpsf994g?w=420)
![[Data Preprocessing] Don't worry! Pandas is here.Course Thumbnail](https://cdn.inflearn.com/public/files/courses/336824/cover/01k5849rtc0vfa7df3revd2tpb?w=420)
![[2026 New] Advanced Data Analytics Semi-Professional (ADsP) CertificationCourse Thumbnail](https://cdn.inflearn.com/public/files/courses/327635/cover/01jqgn3yyg7t1h2ws31j3cyean?w=420)
![[Renewal] First-time SQL and Database (MySQL) Bootcamp [From Beginner to Application]Course Thumbnail](https://cdn.inflearn.com/public/courses/324208/cover/85872a8e-d2bb-4c43-82fc-d55fa067746e/324208.png?w=420)


![[Renewed] MongoDB and NoSQL (Big Data) Database Bootcamp for Beginners [From Introduction to Application] (Updated)Course Thumbnail](https://cdn.inflearn.com/public/courses/324183/cover/fbe9f0cc-4c42-4435-b855-f283f6932415/324183.png?w=420)
![[2026] SQLD All-in-One: Pass on Your First Try Even as a Non-MajorCourse Thumbnail](https://cdn.inflearn.com/public/files/courses/336953/cover/01kfq68bzb04w1mydc92ysfads?w=420)