


Welcome to Tableau World
VizLab
Learn the basics of Tableau, the most popular data visualization tool today.
Basic
Tableau
Master the advanced features of Tableau, the hottest data analysis tool today.

Reviews from Early Learners
5.0
Jang Jaehoon
Thank you for the great lecture!
5.0
수원양민
Thank you for the great lecture.
5.0
SEOTAEJOO
It's really great, I recommend it to others too. The lecture content is good and the instructor's voice, pronunciation, and pace are all excellent. After watching the free videos, I want to study more so I'll continue. Thank you.
Understanding Table Calculations, one of the most difficult topics in Tableau
LOD expression practice, an essential gateway to advanced calculations
Solving Order of Operations issues that you will inevitably encounter while creating Tableau dashboards
What motivated you to create this course? Why did you decide to make it?
I first encountered the tool called Tableau in late 2015. Although Tableau had already been introduced in Korea at that time, I remember it certainly wasn't as popular as it is now. Most people I asked didn't know much about it, and naturally, there were almost no educational contents or materials produced in Korean.
Back then, I remember learning Tableau by clicking around the screen on my own. Additionally, workbooks and blogs created and shared by various Tableau users abroad served as my teachers and contributed greatly to the growth of my Tableau skills.
Even now, the materials from these people continue to inspire me or play a major role in solving problems when I get stuck. Just as their works were a huge help to me in learning Tableau back then, I thought it would be a good idea to systematically organize the content for those studying Tableau in Korea.
As a result, I opened a YouTube channel and began structuring this course by systematically grouping that content once again. I hope you learn a lot and look forward to meeting you as a colleague using the same tool :D
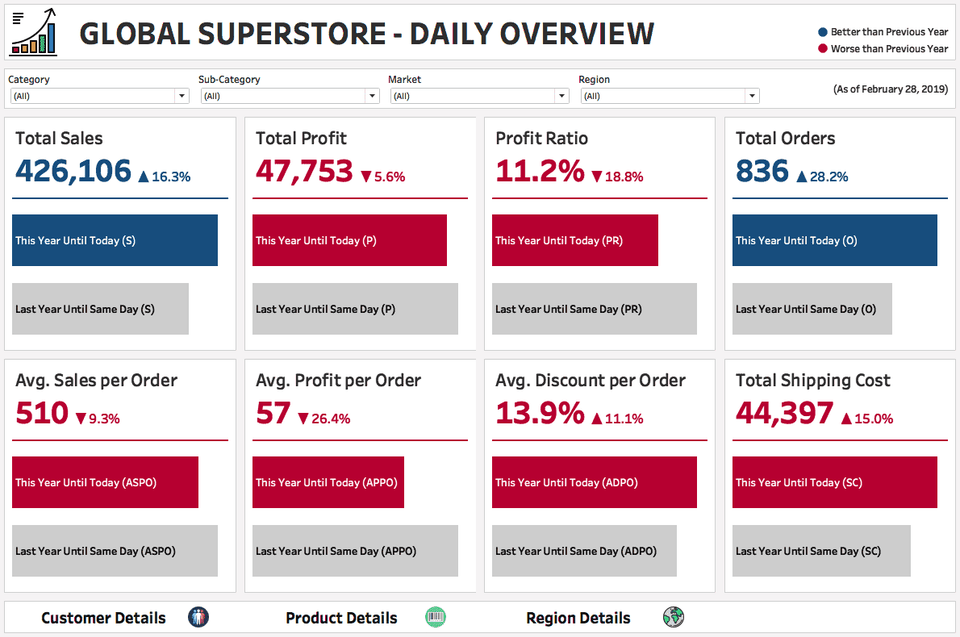
You can do a truly wide variety of things using Tableau. Currently, Tableau is being utilized in countless business fields such as sales, marketing, commerce, journalism, and manufacturing, and recently, there has been a trend of adopting Tableau in the public sector as well. Data art, which beautifully expresses data from an artistic perspective, is another area where Tableau can be applied. Here are a few representative examples of screens that can be created using Tableau.
<Sales Business Dashboard Example>
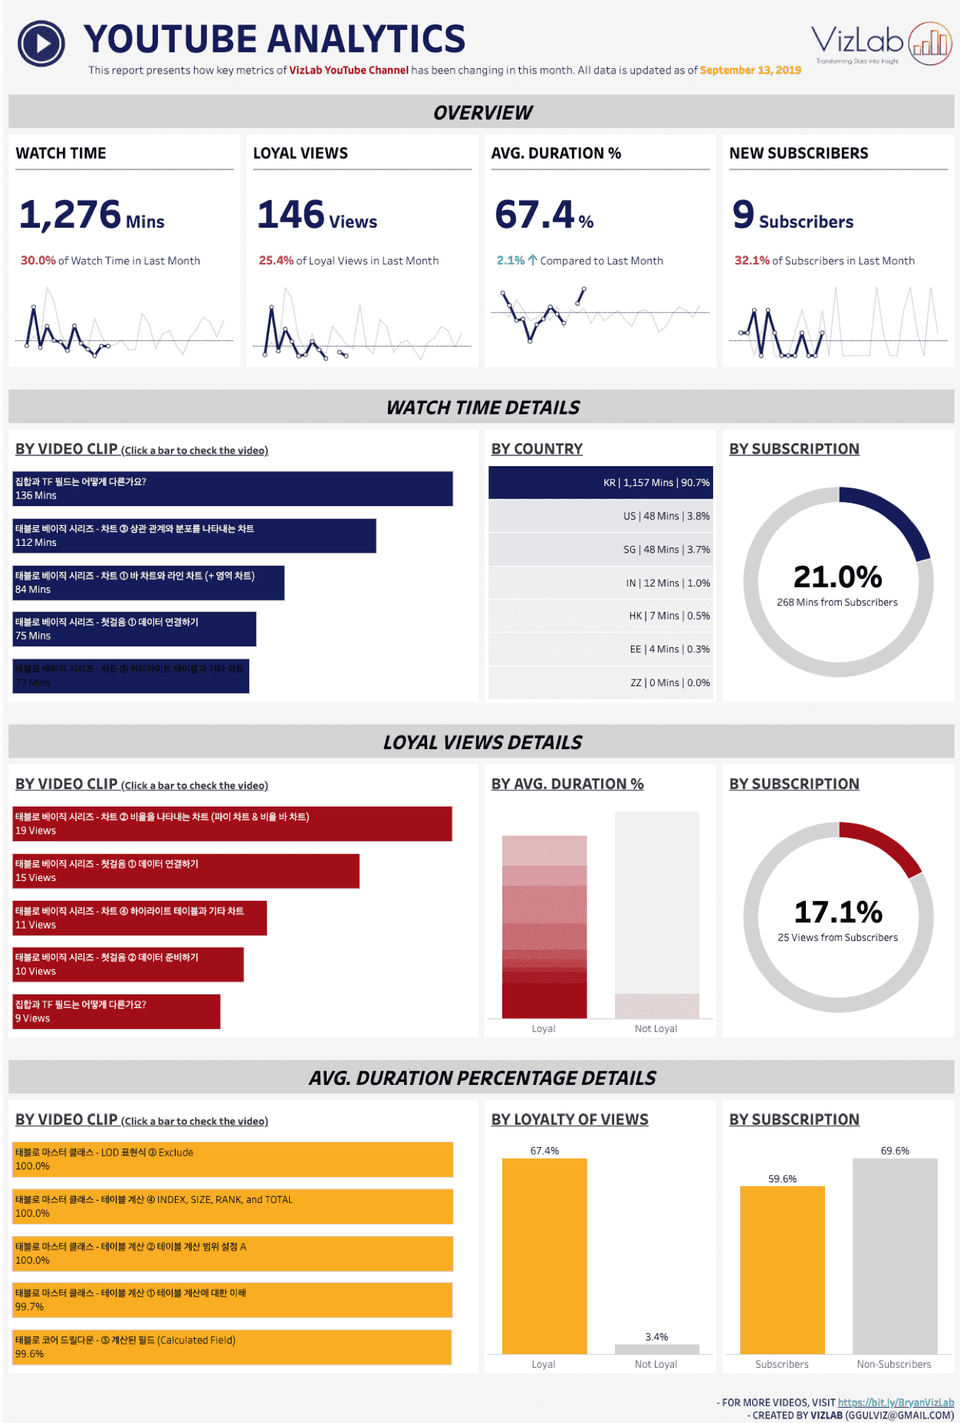
<Media Sector YouTube Channel Monitoring Example>
<Example of data art related to fine dust>

To create screens that show deep insights and clean layouts, you ultimately have no choice but to master Tableau's advanced features. If our goal is not just a few simple sheets, but creating practical screens where necessary information is appropriately combined and filtered to find meaning, you must be well-versed in issues such as Table Calculations, LOD Expressions, and the Order of Operations. Since all these topics are directly linked to understanding how Tableau works at a deeper level, it is important to engage in various exercises built upon a proper theoretical foundation of the concepts. The 'Tableau Level UP' prepared here is the culmination of efforts to explain difficult topics as easily as possible. I am confident it will help improve your Tableau skills!
Tableau Desktop is a paid product, but it comes with a 2-week free trial. You can download the Tableau Desktop version here. Tableau Public is a free product and can be downloaded here. The main differences between the Desktop and Public versions are: (1) the Public version cannot save workbooks to a local machine, and (2) the Public version cannot load data stored in databases. The Public version is perfectly fine for following along with this course. You can download the guide for installing Tableau here. Please refer to it to install Tableau!
Q. Can non-majors take this course?
A. Basically, if you have experience handling data—of any kind—it will be much easier to learn Tableau. This is because learning Tableau is ultimately about dealing with data. However, it is perfectly fine even if you have no such background. I also come from a humanities background and only started analyzing data in earnest when I went to graduate school. So, even without a STEM background, as long as you have the enthusiasm, there are no obstacles to studying Tableau. In fact, I believe this will serve as a great foundation for such individuals to enter the world of data.
Q. Why should I learn Tableau? What are the benefits of learning it?
A. It is the most widely used data visualization and BI tool in the industry. In fact, no other reason is needed. Think of five companies that an average person would recognize. It wouldn't be far-fetched to say that four or five of them are using Tableau. I won't say that Tableau guarantees employment or a career move. However, I can guarantee that Tableau skills will be a "huge" help in getting a job or changing careers.
Q. Are there any special advantages unique to this course?
A. It is true that the number of Tableau-related educational programs in Korea has been increasing recently. This is a welcome development as it means the user base is growing. One of the greatest strengths of this course is that it is systematically structured. When we take a course on how to use tools like PowerPoint or Excel, we don't necessarily cover every single detail from A to Z. It is more desirable to learn the essential techniques frequently used in practice, along with a bit of theoretical background. The remaining minor details can be looked up as needed while using the tool. This course is structured in the same way. Centered around the main features of Tableau, the curriculum is focused on what learners must know to elevate their Tableau skills to the next level. As with the "Welcome to Tableau" class, the lectures are built around examples that can be applied in real-world scenarios. Based on my diverse practical experience, I have filtered out what is important and what is not, and those insights are embedded throughout the curriculum.
Who is this course right for?
Those who have fully understood and successfully completed "Welcome to Tableau World"
Power users who are creating Tableau dashboards in actual business settings
Those who want to study the theoretical background of advanced Tableau features
Those who need to understand how Tableau builds visualizations
Those who want to be recognized as Tableau experts by those around them
Need to know before starting?
It is more effective to take this after completing "Welcome to Tableau World."
10,962
Learners
326
Reviews
126
Answers
4.9
Rating
8
Courses
I am a Tableau Dashboard Developer and Tableau Certified Instructor running VizLab. I build BI dashboards and provide related consulting services for companies in Korea and Europe. I also create and share Tableau-related content on my YouTube channel in my spare time. I look forward to this being a great opportunity for all of us to grow together as we study and share ideas :D
* VizLab Email: bryan@vizlab.kr
* VizLab Profile: https://www.linkedin.com/in/bryan-j-choi/
* VizLab Website: https://vizlab.tistory.com/
* VizLab YouTube Channel: http://bit.ly/BryanVizLab
* VizLab Portfolio: http://bit.ly/BryanWorks
All
14 lectures ∙ (2hr 53min)
All
52 reviews
4.9
52 reviews
Reviews 10
∙
Average Rating 5.0
Reviews 9
∙
Average Rating 5.0
Reviews 4
∙
Average Rating 5.0
Reviews 929
∙
Average Rating 4.9
Reviews 203
∙
Average Rating 4.4
Check out other courses by the instructor!
Explore other courses in the same field!
Free


![[D-PEC UP_PASS] National Technical Qualification: Management Information Visualization Ability (Written Exam)Course Thumbnail](https://cdn.inflearn.com/public/files/courses/336327/cover/01jytyqa2egrzn52a7m57fntzk?w=420)