Welcome to Tableau World
VizLab
Free
Basic / Tableau
4.9
(162)
6,800+
Learn the basics of Tableau, the most popular data visualization tool today.
Basic
Tableau

VizLab's monthly Tableau is a collection of Tableau articles written by people who are using Tableau in the field.
A slightly better way to utilize the software called 'Tableau'
This online seminar was started with the intention of giving people time to think about it.
We'll continue to refine this platform to create a space for everyone to discuss new ideas, better screen layouts, and more efficient calculations, all while working on their own tasks. We hope to grow together by discussing Tableau's real-world use cases with industry experts with extensive domain knowledge. We're open to all kinds of ideas, topics, and datasets. We encourage your active participation ( bryan@vizlab.kr ).
In the March 2020 issue of Monthly Tableau, we covered the fundamentals of Tableau dashboards. We receive many questions about Tableau dashboards, and most of them fall into two broad categories.
The first question is about content.
"What should I include when creating a dashboard in Tableau?"
☑️ Just looking at Tableau won't solve this question. We need to articulate our business questions and structure the information to find answers. This seminar explored how to do this.
Second, this is a question about the technical part.
"I want to create a Tableau dashboard that's easy and intuitive. How can I do that?"
☑️ To achieve this, Tableau offers users a variety of techniques. This seminar highlights only the essential elements. We'll explore these techniques with practical examples for practical use in the field.
Tableau dashboards are a distinct process from working with sheets. The interface is different, and their intended use is different. However, because they are the screens users ultimately see, they must be structured more logically and precisely than sheets. That's why this seminar is so valuable. I'm confident it will serve as a good starting point for anyone considering Tableau dashboards. :D
This is the dashboard image we will be creating in this seminar!
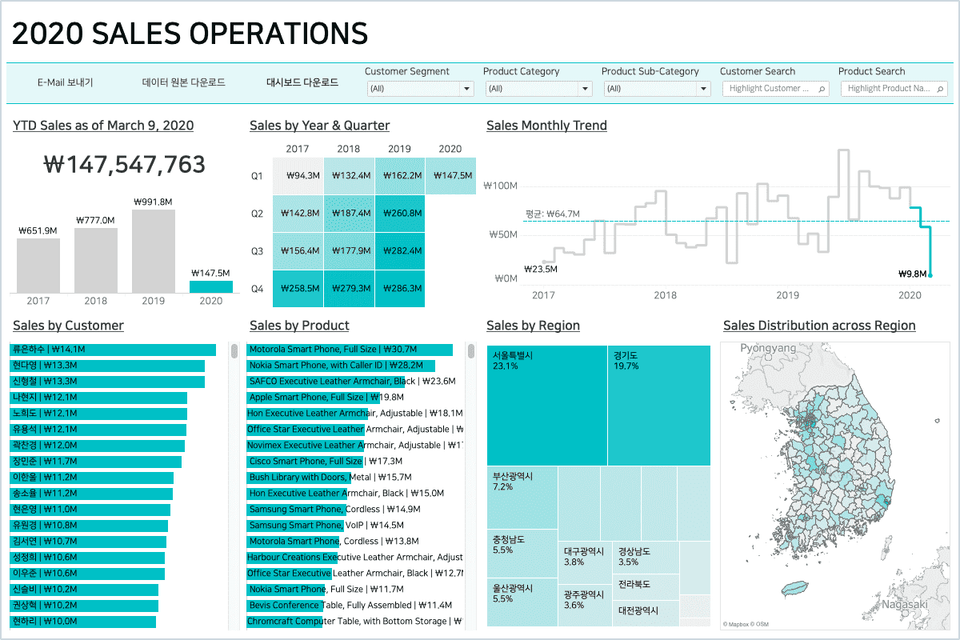
How can we arrange dashboard elements so neatly and visually? This seminar will reveal the secrets of utilizing containers and blank objects.
We'll also look at the essential elements of dashboard actions, the greatest strength of Tableau's dashboards.
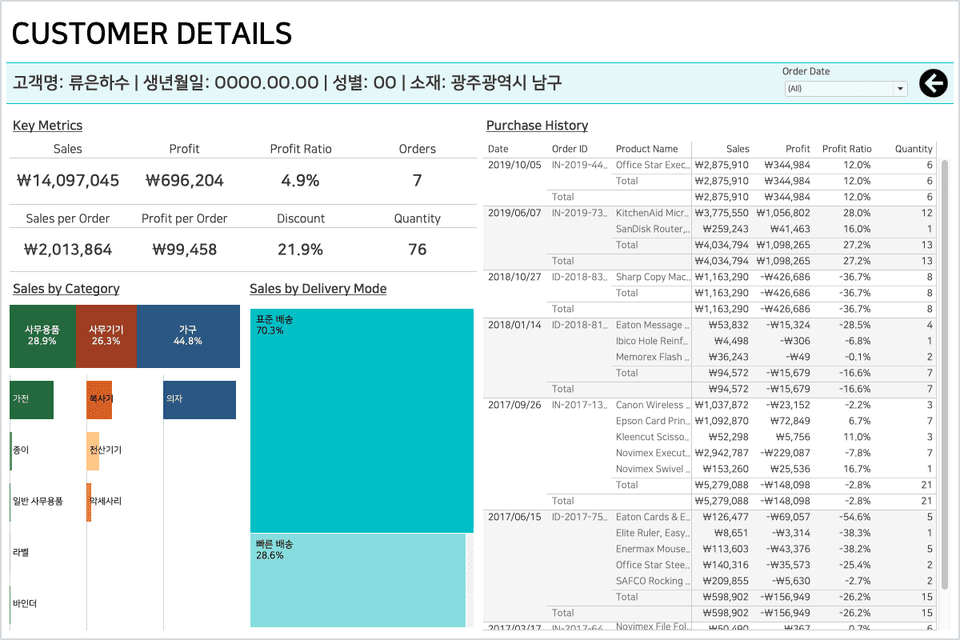
Isn't that a pretty cool feature? Let's learn about the heart of Tableau's dashboard: "Actions"!
![]()
Tableau Desktop Professional is a paid product, but offers a two-week free trial. You can download Tableau Desktop here .
The Tableau Public version is free to use and can be downloaded here .
The biggest difference between the desktop version and the public version is
(1) The public version cannot save the created workbook to the local machine.
(2) The public version cannot retrieve data stored in the database.
The public version is also suitable for following this course. Guidelines for installing Tableau can be downloaded here . However, the Tableau workbook provided in the course cannot be opened in the public version of Tableau. Therefore, public users must install Tableau Reader (download here ) to open the provided workbook.
This seminar is a recording of an online seminar held LIVE on March 9, 2020.
It's been properly edited and organized into a format that's easy to learn. Please refer to it when making your purchase decision!
Q. Who would benefit from this seminar?
A. If you're thinking, "I've done some work with Tableau sheets, but I'm at a loss as to how to create a dashboard," I think I can offer some clues to help you solve your problem. We also welcome those who say, "I've created a few dashboards before, but I'm not entirely satisfied with them. I'd like to see them laid out and designed more neatly." Since this course covers only the most fundamental aspects of Tableau dashboards, even those without extensive Tableau experience can participate without much difficulty.
Q. What functional aspects of Tableau will this seminar cover?
A. After a brief theoretical introduction to creating a great dashboard, we'll move on to practical exercises. We'll first examine the differences between grid and floating methods for creating Tableau dashboards, and then we'll create a dashboard using containers and blank objects. We'll learn how to apply highlight actions, filter actions, and URL actions to the completed dashboard, and we'll demonstrate how to configure buttons that can be helpful in terms of UI/UX.
Q. Is there anything I need to prepare before attending this seminar?
A. While no prior training is required, if you learn the basics of Tableau through the Welcome to Tableau class, you'll find it easier to participate in this seminar. Additional resources for learning about Tableau dashboards, including practical examples of dashboards used in real-world situations, are available at the very end of the course.
Q. Where can I download study materials?
A. The study materials for this seminar can be downloaded from Section 1, Lesson 1, Seminar Planning Video after purchasing the course. The materials consist of (1) the Superstore KR - VizLab 2020 Excel data file, (2) the seminar guide document, and (3) a Tableau workbook for practical training.
It's great because it helps you develop your data visualization skills, not just Tableau.
The approach is fresh and convincing~
It's really interesting! This was content I really wanted to know about, and you explained it so well that I learned a lot.
The instructor's voice and explanations are both clear and easy to understand. If you want to level up your Tableau skills, I highly recommend this!!
The composition was good.


![[D-PEC UP_PASS] National Technical Qualification: Management Information Visualization Ability (Written Exam)Course Thumbnail](https://cdn.inflearn.com/public/files/courses/336327/cover/01jytyqa2egrzn52a7m57fntzk?w=420)