Welcome to Tableau World
VizLab
Learn the basics of Tableau, the most popular data visualization tool today.
Basic
Tableau
Tableau Map, it has it all, and it overflows.
72 learners
Level Basic
Course period Unlimited

Reviews from Early Learners
5.0
주무세요
I was just doing general data analysis and then I started learning GIS analysis for the first time. It was very helpful. It was very helpful because it explained the basics of GIS in detail.
5.0
pungryol.eom
Thank you for the great lecture.
5.0
유희석
I'm new to Tableau, and listening to the lectures from "Welcome to Tableau" onwards has really helped me get a grasp of it. I'm taking this course urgently because of map visualizations, but the instructor is so good at teaching that it's great for getting an overview of what Tableau is and what you can do with it.
The Power and Dangerous Temptations of Map Visualization
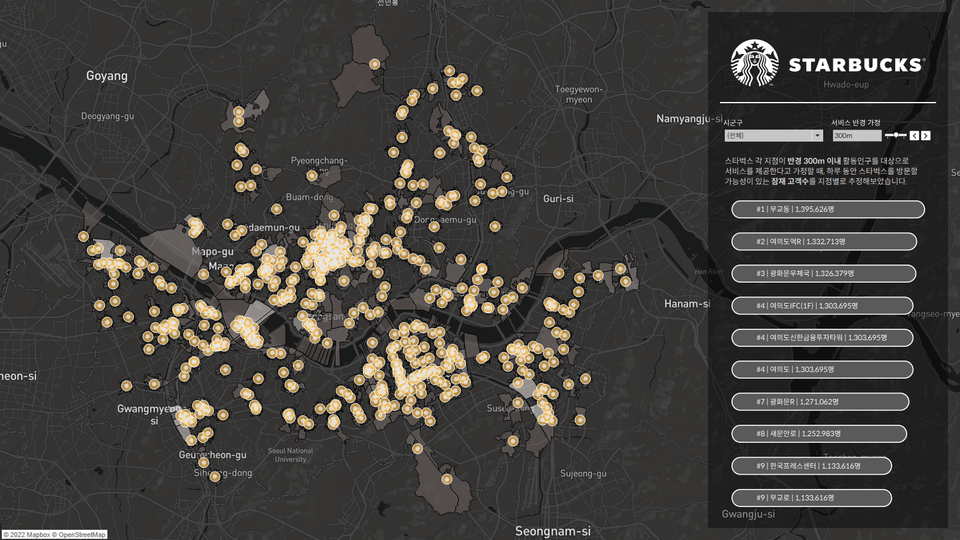
How to approach answering questions like "How many Starbucks are located near a subway station?"
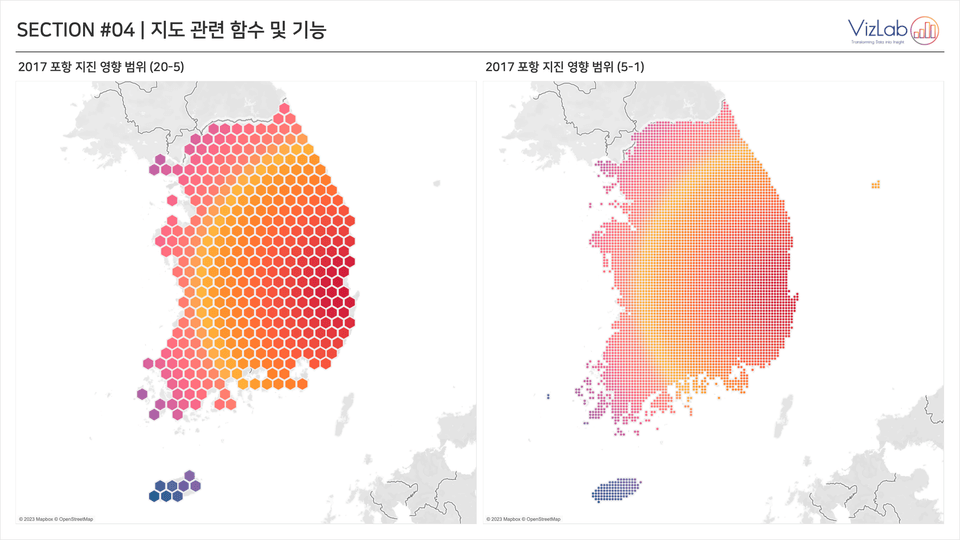
A fresh way of expressing yourself beyond traditional map visualization
Almost all other map-related functions used in Tableau
Tableau Map Visualization
Experience the infinite possibilities firsthand! 🗺️
👉 You can think of this lecture as the culmination of my own efforts to figure out how to best utilize the unique data representation method called 'map' !
Take a close look at the information below and consider whether this course is right for you!
“I’m interested in representing information with maps, but I don’t have any expertise in maps ... 😓”
👉 That's okay! We'll start from the basics and work our way up to a fairly high level!
"Isn't the map in Tableau a bit obvious? Are there any specific tips or tricks ? 🤔"
👉 Welcome to those who think like this. Let's explore various possibilities together!
“I use maps a lot in Tableau, but it’s too much of a hassle to search Google every time I need them 🥲”
👉 All the necessary map-related functions are gathered in this lecture!
So, I especially recommend this to these people.
This course teaches techniques, but it won't stop there. When learning something new, understanding the underlying principles is paramount. Since we face the real world, not the laboratory, we need to apply what we've learned. To be able to apply that knowledge, we must first grasp the underlying principles.
I know how tedious and uninteresting learning concepts and principles can be. One of the strengths of this course is its ability to simplify concepts with as many examples, diagrams, and analogies as possible.
We're generously releasing all copyright-free materials, from painstakingly crafted templates to map-related resources. Experience a new world of map visualization!
I hope you learn more about VizLab's know-how and valuable tips. Asking multiple questions will broaden your understanding and discover new possibilities you hadn't previously considered, making your learning experience even more meaningful.
Tableau releases updated versions with new features every quarter. Looking at the trends over the past two to three years, map-related features have been strengthened. So, we can assume that new features will continue to be added in the future.
I hope you learn more about VizLab's know-how and valuable tips. Asking multiple questions will broaden your understanding and discover new possibilities you hadn't previously considered, making your learning experience even more meaningful.
"I believe a quality lecture is more about experience and depth of interpretation than a wealth of knowledge. The depth of knowledge I've built by meeting countless Tableau students since 2018 is something no one can imitate or replicate. Ultimately, it's a result of the accumulation of time.
This course embodies all the experience, effort, and dedication I've put into it. I dare say it's the highest quality Tableau map-related content available today !”

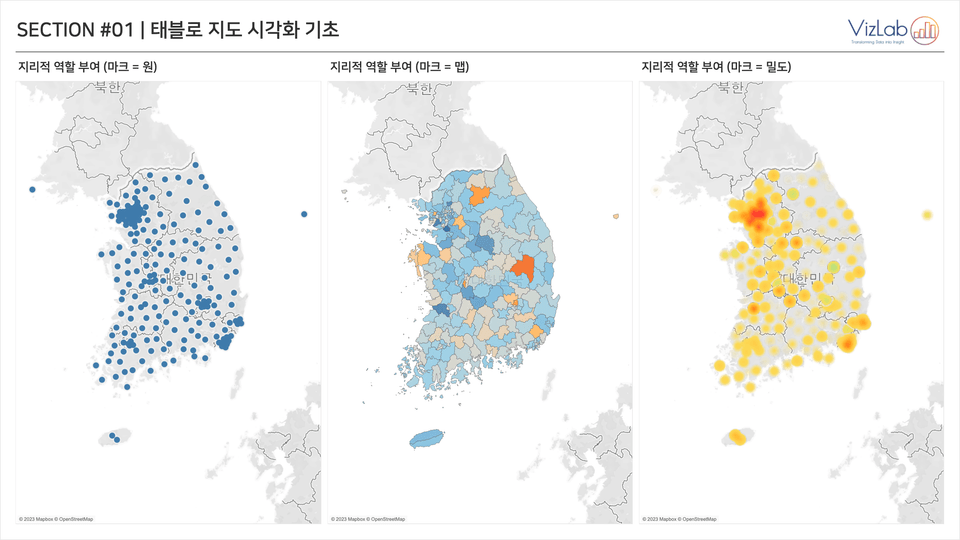
💡 After examining the strengths and weaknesses of map visualization, we'll delve into the fundamental "geographic role" of Tableau maps. We'll also briefly touch upon Tableau's map exploration tools.
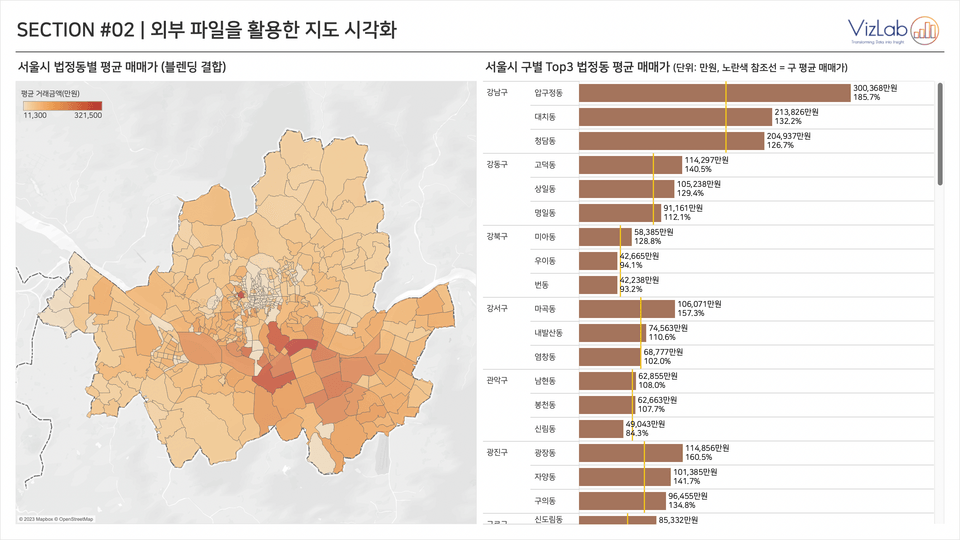
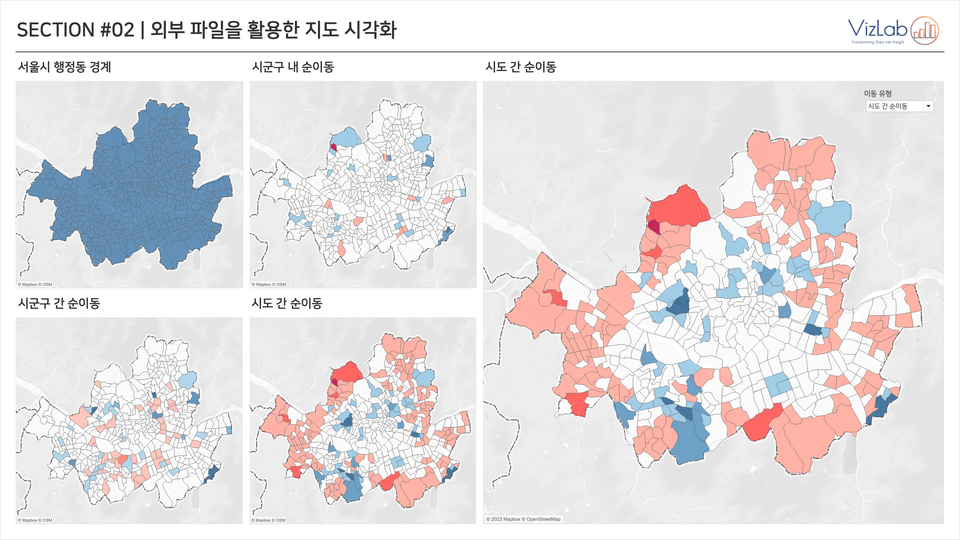
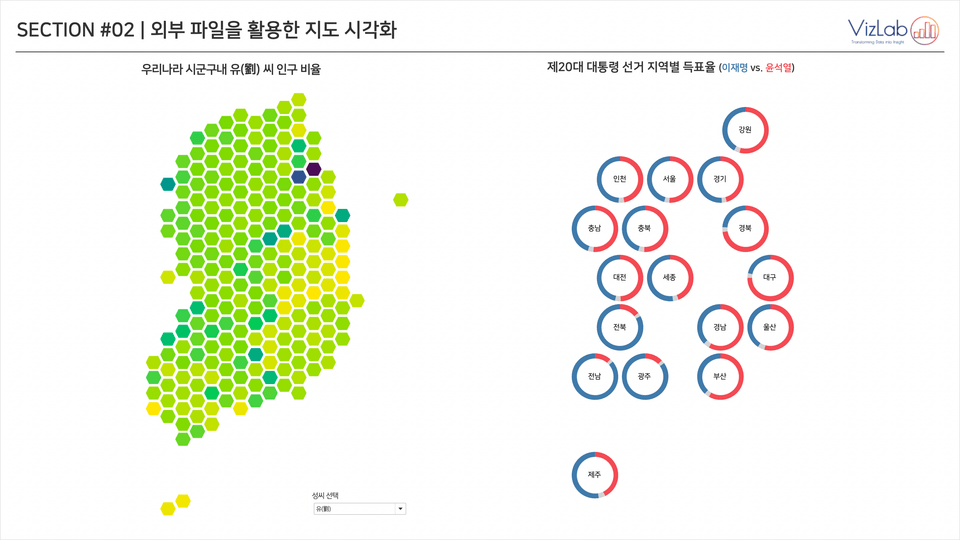
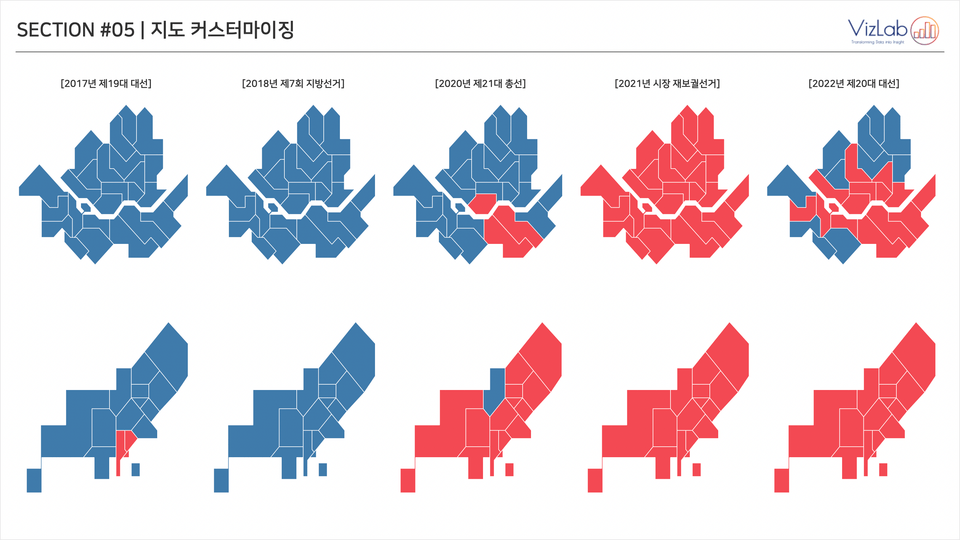
💡 We'll introduce three types of geographic boundary information you can prepare for map visualization at a level lower than the city, county, or district level. We'll also explore three ways to combine geographic boundary information with data.
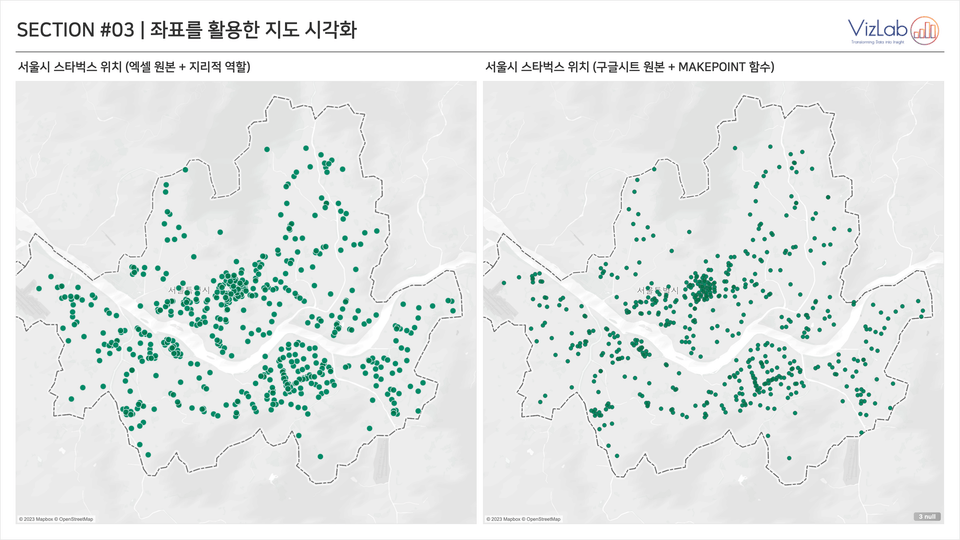
💡 Learn about geocoding, the process required to display point data on a map. We'll introduce three free geocoding methods and practice two methods for displaying the acquired coordinates on a Tableau map.
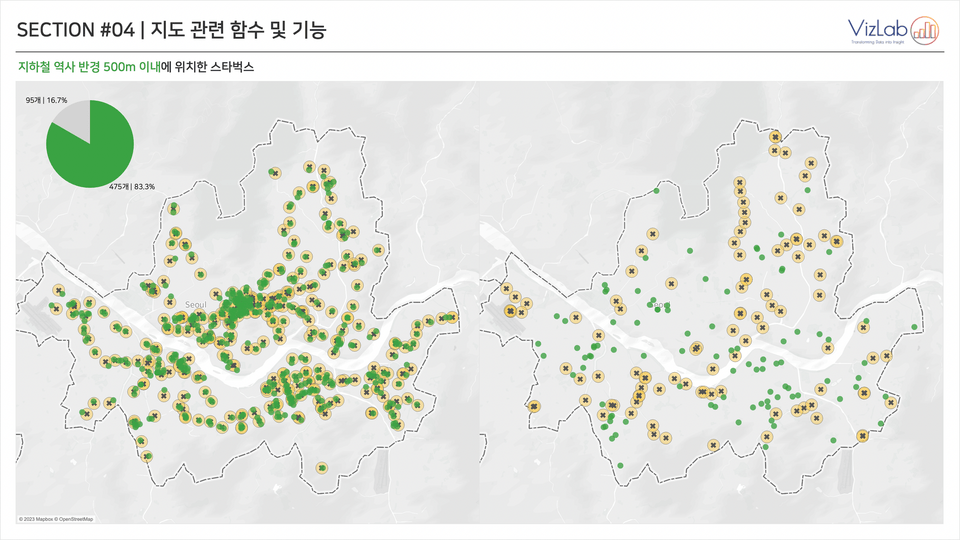
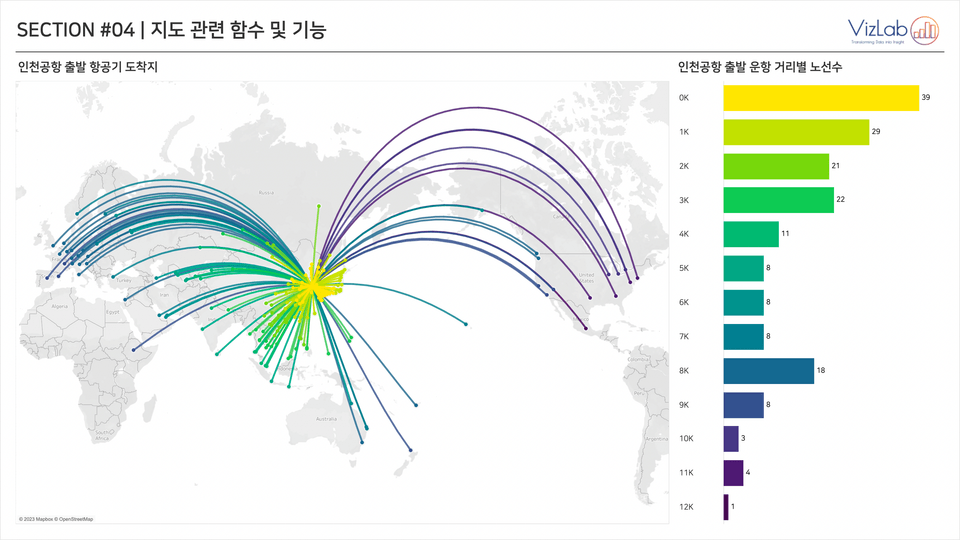
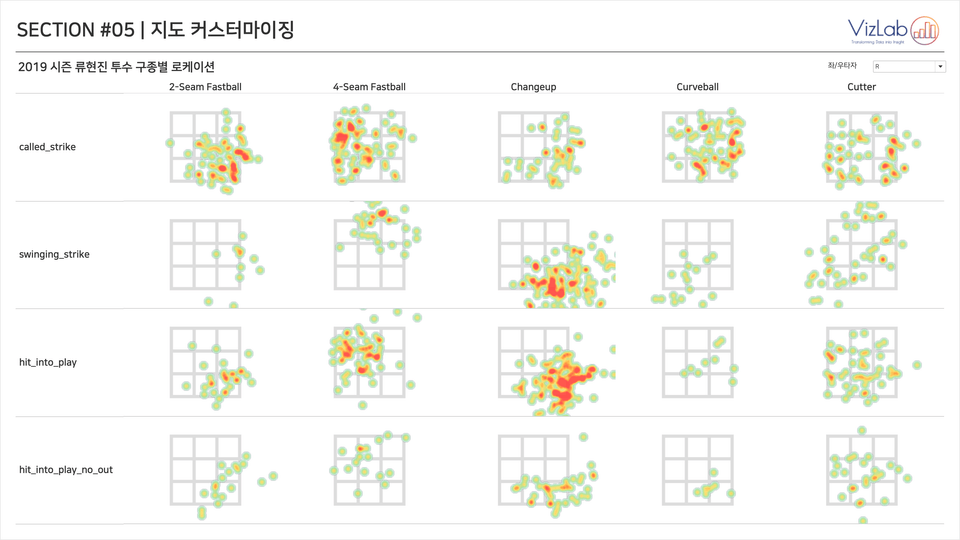
💡 This course delves into the functions and features required to perform spatial analysis. This course focuses on practical exercises that explore the process involved in finding answers to simple business questions.
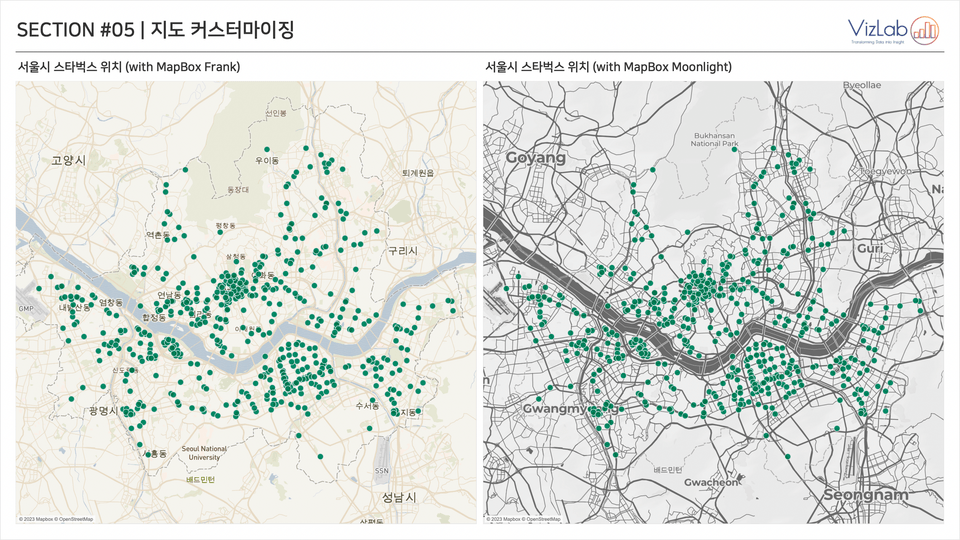
💡 Learn how to prepare and apply various map backgrounds available in Tableau. Let's create visually appealing and engaging maps together.
Since first starting with Tableau in 2015, I've been working as a data visualization instructor and Tableau dashboard developer for many years. Seeing is believing. Here are just a few of the map-related visualizations I've worked on.
If you're wondering, "This person's portfolio isn't bad, but maybe their lectures are a bit lacking?" There are plenty of resources you can try out beforehand. Check out a few and decide for yourself :) (Go directly to the VizLab YouTube channel >>)
Q. Do I need to pay for Tableau to take this course?
No, that's not the case. This course uses Tableau Desktop software. Tableau Desktop comes in two versions: Professional (paid) and Public (free). This course is also available using Tableau Desktop Public.
Q. I don't know anything about Tableau. I'd like to start with this course. Is that okay?
This course is not recommended. While it covers the basics of Tableau maps, it doesn't offer a detailed explanation of Tableau's fundamentals. We recommend starting with the free Welcome to Tableau World course. Completing the Tableau Level Up course will make it much easier to understand.
Q. I've used Tableau before, but I don't have much knowledge about maps. Will I be able to follow this course?
Welcome! This course is designed for you. It covers everything from a basic understanding of maps to the advanced features currently available in Tableau. I'm confident you'll find it a rewarding experience.
💾 Please check before taking the class!
Who is this course right for?
People who frequently use map-related functions in Tableau
Anyone interested in representing data on maps
To all who love Tableau
Need to know before starting?
Welcome to Tableau World
Tableau Level Up
10,965
Learners
326
Reviews
126
Answers
4.9
Rating
8
Courses
I am a Tableau Dashboard Developer and Tableau Certified Instructor running VizLab. I build BI dashboards and provide related consulting services for companies in Korea and Europe. I also create and share Tableau-related content on my YouTube channel in my spare time. I look forward to this being a great opportunity for all of us to grow together as we study and share ideas :D
* VizLab Email: bryan@vizlab.kr
* VizLab Profile: https://www.linkedin.com/in/bryan-j-choi/
* VizLab Website: https://vizlab.tistory.com/
* VizLab YouTube Channel: http://bit.ly/BryanVizLab
* VizLab Portfolio: http://bit.ly/BryanWorks
All
87 lectures ∙ (12hr 11min)
Course Materials:
18. shp file review
10:00
All
6 reviews
5.0
6 reviews
Reviews 2
∙
Average Rating 5.0
5
I'm new to Tableau, and listening to the lectures from "Welcome to Tableau" onwards has really helped me get a grasp of it. I'm taking this course urgently because of map visualizations, but the instructor is so good at teaching that it's great for getting an overview of what Tableau is and what you can do with it.
Reviews 3
∙
Average Rating 4.7
5
I was just doing general data analysis and then I started learning GIS analysis for the first time. It was very helpful. It was very helpful because it explained the basics of GIS in detail.
Thank you! If you have experience in the GIS field, it shouldn't have been too difficult, so I'm glad you finished it well. Please try using it in the field and leave a question if you have any difficulties :D
Reviews 5
∙
Average Rating 5.0
Reviews 1
∙
Average Rating 5.0
5
I enjoyed the lecture. I had an idea in my head, and this was the lecture I wanted. I was using another BI tool and now I am using Tableau, and it was easy to understand with the friendly explanation. And it is also good that Q&A is available. I think I will continue to have questions as I proceed, so thank you in advance.
Reviews 8
∙
Average Rating 5.0
Check out other courses by the instructor!
Explore other courses in the same field!


![[D-PEC UP_PASS] National Technical Qualification: Management Information Visualization Ability (Written Exam)Course Thumbnail](https://cdn.inflearn.com/public/files/courses/336327/cover/01jytyqa2egrzn52a7m57fntzk?w=420)