Tableau Dashboard Basics
VizLab
$13.20
Basic / Tableau
4.8
(59)
500+
Provides clear explanations of two of the most frequently asked questions about Tableau dashboards - dashboard content structure and technical elements.
Basic
Tableau
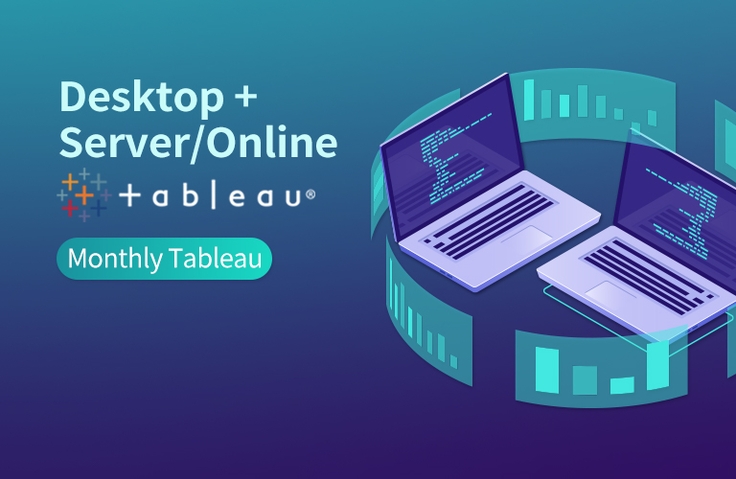
Here’s an example of the synergy that can be created when combining Tableau Desktop and Server/Online. Let’s build a pipeline together to see how data can lead to concrete actions!
Reviews from Early Learners
5.0
즐거운 참새
I really liked how you explained in an easy-to-understand way how to think and visualize when you actually receive a data analysis request!
5.0
김영우
It was a very informative class.
5.0
주형철 (입학관리실)
very good!
Configuring Dashboards on Tableau Desktop
Leveraging Tableau Desktop Dashboard Filter Actions and URL Actions
Upload dashboards created on Tableau Desktop to Tableau Server/Online
Automatic update of data extraction from Tableau Server/Online
Setting up Data-Driven Alerts on Tableau Server/Online
VizLab's monthly Tableau is an online seminar that started with the purpose of thinking about better ways to utilize the software called 'Tableau' together with people who are using Tableau in the field.
We'll continue to refine this platform to create a space for everyone to discuss new ideas, better screen layouts, and more efficient calculations, all while working on their own tasks. We hope to grow together by discussing Tableau's real-world use cases with industry experts with extensive domain knowledge. We're open to all kinds of ideas, topics, and datasets. We encourage your active participation ( bryan@vizlab.kr ).

In May 2020, in our fifth monthly issue, Tableau, we explored the automation of business processes, which can be achieved by combining Tableau Desktop with Server/Online. The ultimate goal of leveraging data in the workplace is to develop concrete action plans and drive behavioral change. However, if human resources are required to produce outputs from the data collection and analysis process to the subsequent stages, it's questionable whether organizations can afford such an excessive investment of resources.
This is where Tableau can play a role. If you can delegate some, if not all, of the overall pipeline to Tableau, creating an environment where Tableau can work autonomously, freeing up people to focus on higher-value tasks! In May's Monthly Tableau, we explored this automation process deployment use case, broadly categorizing it into tasks on Tableau Desktop and tasks on Tableau Server/Online.
☑️ We can't just sit back and let Tableau figure out what information it needs to report on its own. We need to tell Tableau what we need, such as, "I want to receive reports on a regular basis, combining various pieces of information." The screens that meet these needs are implemented on Tableau Desktop. In this seminar, we'll create a big-picture dashboard that displays the overall status and a detailed dashboard that displays detailed information from that dashboard, and then connect the two dashboards.
☑️ No matter how well you design a screen that displays current status, if you have to manually check Tableau every day, your work process is ultimately not automated. Using Tableau Server/Online, you can configure the briefing screen you created on your desktop to be sent to you by email at a specified interval. Even if you don't physically access Tableau Server/Online to check the status, Tableau will continue to provide this information, allowing you to spend more time thinking about what actions to take using the information.
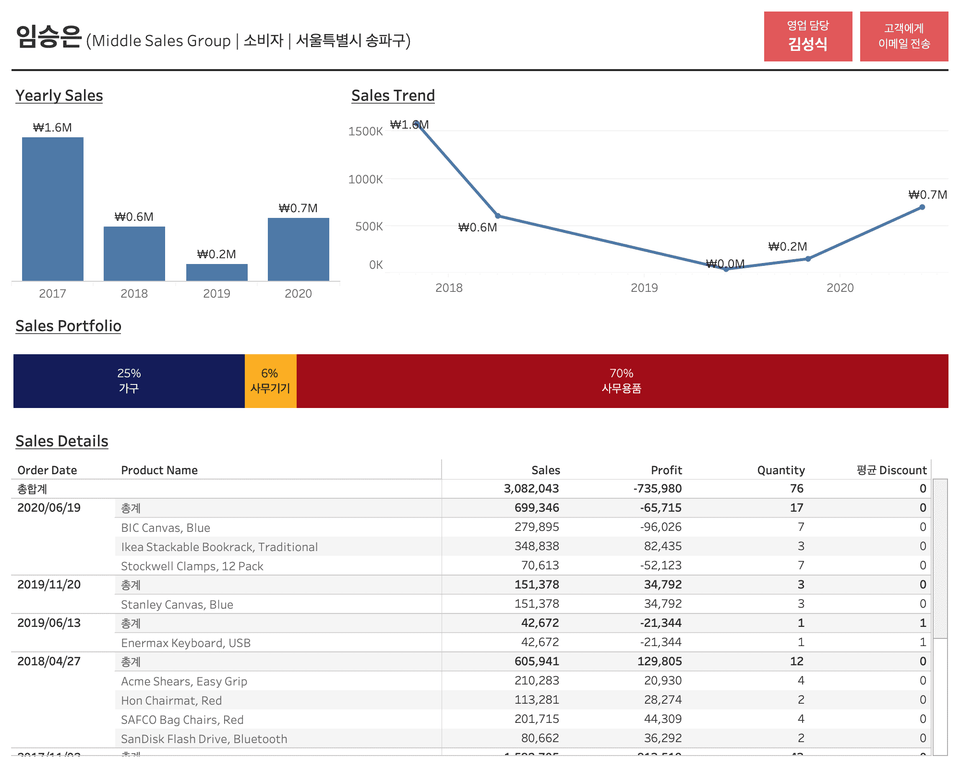
This is the chart image we will be creating in this seminar!
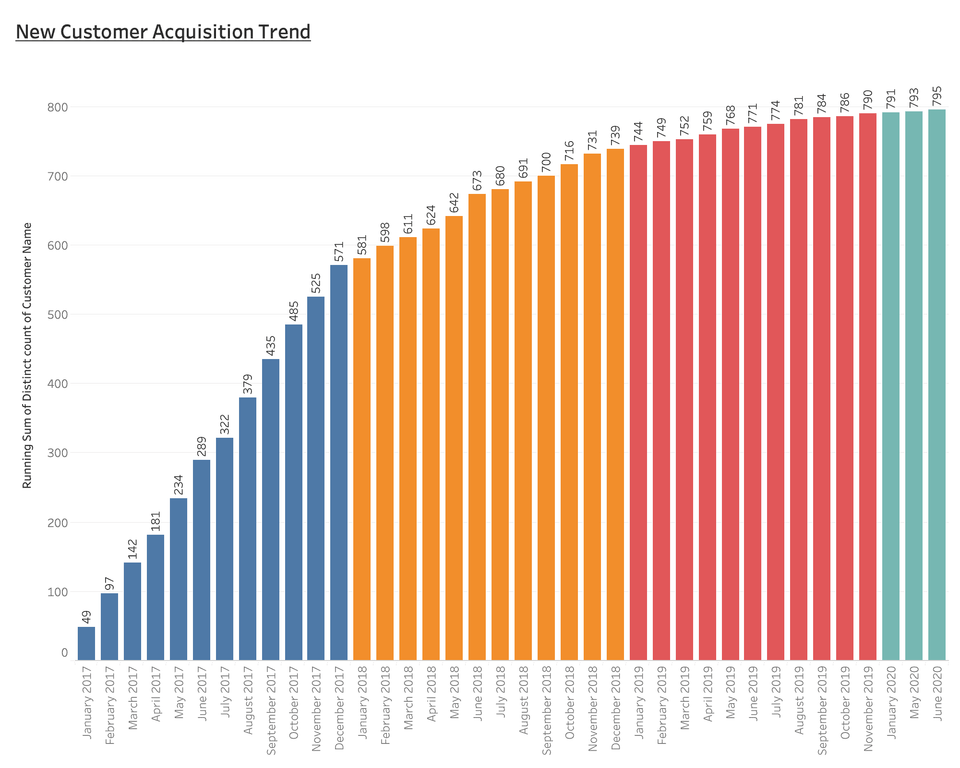
First, we'll review the business scenario and then create the chart above to examine the company's current challenges. Since the rate of new customer acquisition is slowing over time, it appears the company will need to retarget existing customers to drive consistent growth.
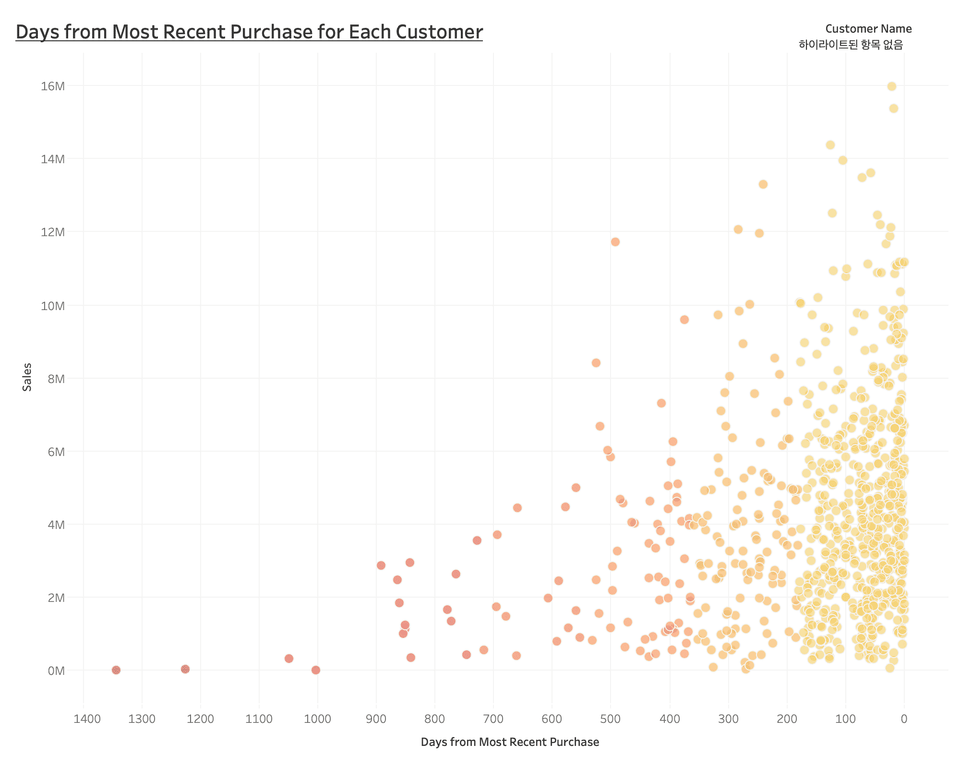
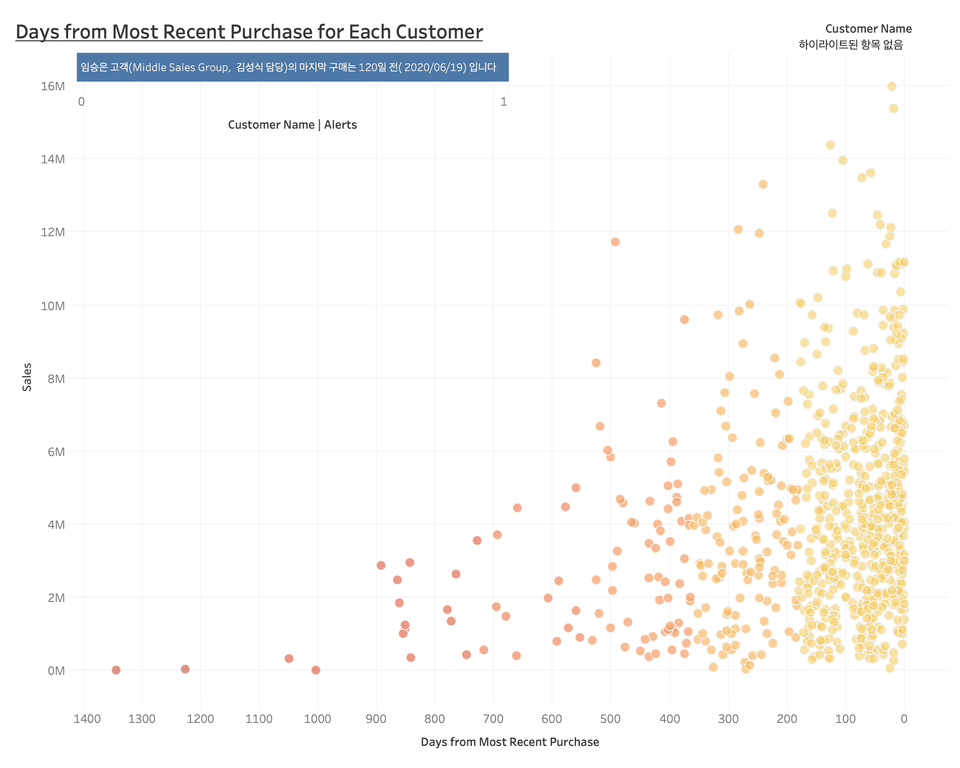
This leaves us with the difficult question of "Who should we remarket to?" The chart above visually shows how many days have passed since each customer last purchased. It's easy to see how many customers haven't returned to your company for a long time.
While the chart above provided a comprehensive picture of a customer's final purchase, the chart below shows the detailed purchase history of each individual customer. We'll implement a system where selecting a circle (a single customer) in the chart above will link to the following customer detail dashboard.
After reviewing the detailed purchase history of a selected customer, if you determine communication is necessary, you can click the "Send Email to Customer" button in the upper right corner to send an email. By effectively utilizing Tableau's dashboard action features, you can create a seamless "Customer Care Pipeline."
Finally, let's answer the most important question of this seminar: "So, do we really need to manually identify each customer to whom we should send an email by reviewing their overall purchase history every time?" The answer, of course, is no. In this seminar, we'll learn how to entrust Tableau with the task of identifying these "customers in need of contact." So, what should the company's managers do? They should consider how to re-engage these identified customers and develop repurchase promotion strategies to increase overall retention rates. This is a high-level question.
How much easier would our work be if Tableau, when displaying the final purchase screen for each customer, could notify us of customers who haven't returned to our company for a certain number of days (e.g., 120 days)? Furthermore, if we could receive this screen via daily email, even if we weren't actively accessing the Tableau server or online, our customer retention system would undoubtedly become much more efficient and effective!
In this seminar, we will clearly show you that all of this is possible within Tableau :D
![]()
Tableau Desktop Professional is a paid product, but offers a two-week free trial. You can download Tableau Desktop Professional here .
The Tableau Desktop Public version is available for free and can be downloaded here .
The biggest difference between the desktop Pro version and the public version is
(1) The public version cannot save the created workbook to the local machine.
(2) The public version cannot retrieve data stored in the database.
Unlike other monthly Tableau seminars, this seminar includes content utilizing Tableau Server and Online. Therefore, the latter half of the seminar, which involves using the public version, is not available for hands-on practice. However, please note that the dashboard creation portion of the seminar, which continues through the middle section, can be used in the same way as the desktop Pro version. Tableau installation guidelines can be downloaded here . However, the Tableau workbook provided in the seminar cannot be opened in the public version of Tableau. Public users must install Tableau Reader (download here ) to open the workbook provided.
This seminar is a recording of an online seminar held LIVE on May 11, 2020.
It's been properly edited and organized into a format that's easy to learn. Please refer to it when making your purchase decision!
Q. Who would benefit from this seminar?
A. The essence of Business Intelligence is driving concrete, practical actions based on data. If you're curious about how this essence of BI is realized through the combination of Tableau's diverse product lines, this seminar is highly recommended. We'll discuss how Tableau can replace the manual review process that was previously performed manually, how Tableau's product lines can be leveraged to automate the entire customer care process, and what we should focus on when this happens. We're also open to those interested in learning about basic use cases for Tableau Server and Online. We'll also briefly cover how to set up automatic data extraction updates in Tableau Server and Online and how to activate email alerts.
Q. What functional aspects of Tableau will this seminar cover?
A. In Tableau Desktop, you'll utilize various calculated fields centered around the IF function, FIXED LOD expressions, and dashboard actions like filter and URL actions. If you're comfortable with these concepts, you should have no trouble following the seminar. In Tableau Server/Online, we'll cover features like uploading dashboards from the desktop version to the server/online version, automatic data extraction updates, and setting up email alerts. While this may seem unfamiliar to those unfamiliar with the Tableau Server/Online environment, the content itself isn't overly difficult, so it should be manageable.
Q. Is there anything I need to prepare before attending this seminar?
A. Assuming a scenario where the dataset is updated over time, we will implement an environment that automatically updates data extraction from the actual Tableau server/online. Because this environment is difficult to build using an Excel file, we will share the dataset as a Google Spreadsheet. Therefore, if you prepare a Google account in advance, you can participate immediately. Furthermore, since this seminar covers intermediate to advanced Tableau features, we recommend completing prerequisite courses such as Welcome to Tableau , Tableau Level Up , and Tableau Dashboard Basics before attending to facilitate participation.
Q. Where can I download study materials?
A. The study materials for this seminar can be downloaded from Section 0, Lecture 2, Business Scenarios after purchasing the course. The materials consist of (1) the Superstore KR - VizLab 2020 - MT05 Google Spreadsheet dataset link, (2) the Superstore KR - VizLab 2020 - MT05 Excel data file, (3) the seminar guide document, and (4) a Tableau workbook for hands-on practice (Version 2020.2 & 2019.1).

Tableau, Tableau Desktop, Tableau Server, Tableau Online, Data Visualization, Dashboard
Who is this course right for?
Anyone who wants to see examples of business automation using Tableau product lines
Anyone who needs a basic understanding of Tableau Server/Online usage
Anyone who is planning a pipeline structure that leads data to specific actions in the business
Need to know before starting?
Welcome to Tableau World
Tableau Level Up
Tableau Dashboard Basics
10,961
Learners
326
Reviews
126
Answers
4.9
Rating
8
Courses
I am a Tableau Dashboard Developer and Tableau Certified Instructor running VizLab. I build BI dashboards and provide related consulting services for companies in Korea and Europe. I also create and share Tableau-related content on my YouTube channel in my spare time. I look forward to this being a great opportunity for all of us to grow together as we study and share ideas :D
* VizLab Email: bryan@vizlab.kr
* VizLab Profile: https://www.linkedin.com/in/bryan-j-choi/
* VizLab Website: https://vizlab.tistory.com/
* VizLab YouTube Channel: http://bit.ly/BryanVizLab
* VizLab Portfolio: http://bit.ly/BryanWorks
All
9 lectures ∙ (1hr 7min)
Course Materials:
All
9 reviews
4.7
9 reviews
Reviews 1
∙
Average Rating 5.0
Reviews 3
∙
Average Rating 5.0
5
It was a very informative class.
Did you have any difficulties while proceeding? If there is a part that can be applied on site, try it, and if there is a part that you get stuck on, please leave a message!
Reviews 3
∙
Average Rating 5.0
5
I listened to it all in one day. Thank you for the great lecture.
I hope this helps you with your work :D
Check out other courses by the instructor!
Explore other courses in the same field!
25% off for new members
$16.40
25%
$26.40


![[D-PEC UP_PASS] National Technical Qualification: Management Information Visualization Ability (Written Exam)Course Thumbnail](https://cdn.inflearn.com/public/files/courses/336327/cover/01jytyqa2egrzn52a7m57fntzk?w=420)