태블로 대시보드 기초
VizLab
태블로 대시보드와 관련해서 가장 많이 받는 질문 두 가지 - 대시보드 콘텐츠 구성과 기술적 요소 - 에 대한 명쾌한 설명을 제시합니다
Basic
Tableau
This course is a hands-on exercise in creating a dashboard in Tableau to monitor customer acquisition and retention, and then deriving insights from the completed dashboard.

How to Create a Cohort Chart Using Tableau
Creating a Customer Retention Monitoring Dashboard
Understanding the AppFlyer data structure
Practical use cases of LOD expressions
Practical examples of using regular expressions
Practical use cases for context filters
What prompted you to create this course? Why did you create it?
VizLab's Monthly Tableau is an online seminar launched with the goal of exploring how to better utilize Tableau software with Tableau users in the field. Each person uses Tableau in their own way for their own work, and we will continue to refine it to create a space for discussion on new ideas, better screen layouts, and more efficient calculations. We hope to grow together by discussing real-world use cases for Tableau with experts with extensive domain knowledge. We are open to all ideas, topics, and datasets. We encourage your active participation (bryan@vizlab.kr).
In January 2020, the first topic of Monthly Tableau is customer retention . A topic of interest to every company seeking to make money, acquiring new customers and keeping them from leaving are the core of customer management and, more broadly, the secret to business success. This month, Monthly Tableau explored how to monitor customer acquisition and retention patterns with marketing professionals across various industries. While the monitoring dashboard we created may not be the definitive answer, we hope it serves as a starting point for marketers to consider their own strategies.
While I always caution against overthinking, I'll conclude this lengthy explanation by highlighting just two key features of this seminar. First, this seminar was designed with the AppsFlyer platform in mind, which is gaining traction in the marketing, advertising, and customer behavior tracking sectors. Collaborations between Tableau and AppsFlyer are becoming more common these days, and in line with this trend, I created a Tableau dashboard using AppsFlyer sample data. Second, I analyzed the behavioral patterns of game users based on a hypothetical business scenario. Beyond simply learning and mastering Tableau skills, this seminar was more like a storytelling experience, showcasing trends revealed by actual sample data and drawing conclusions from them.
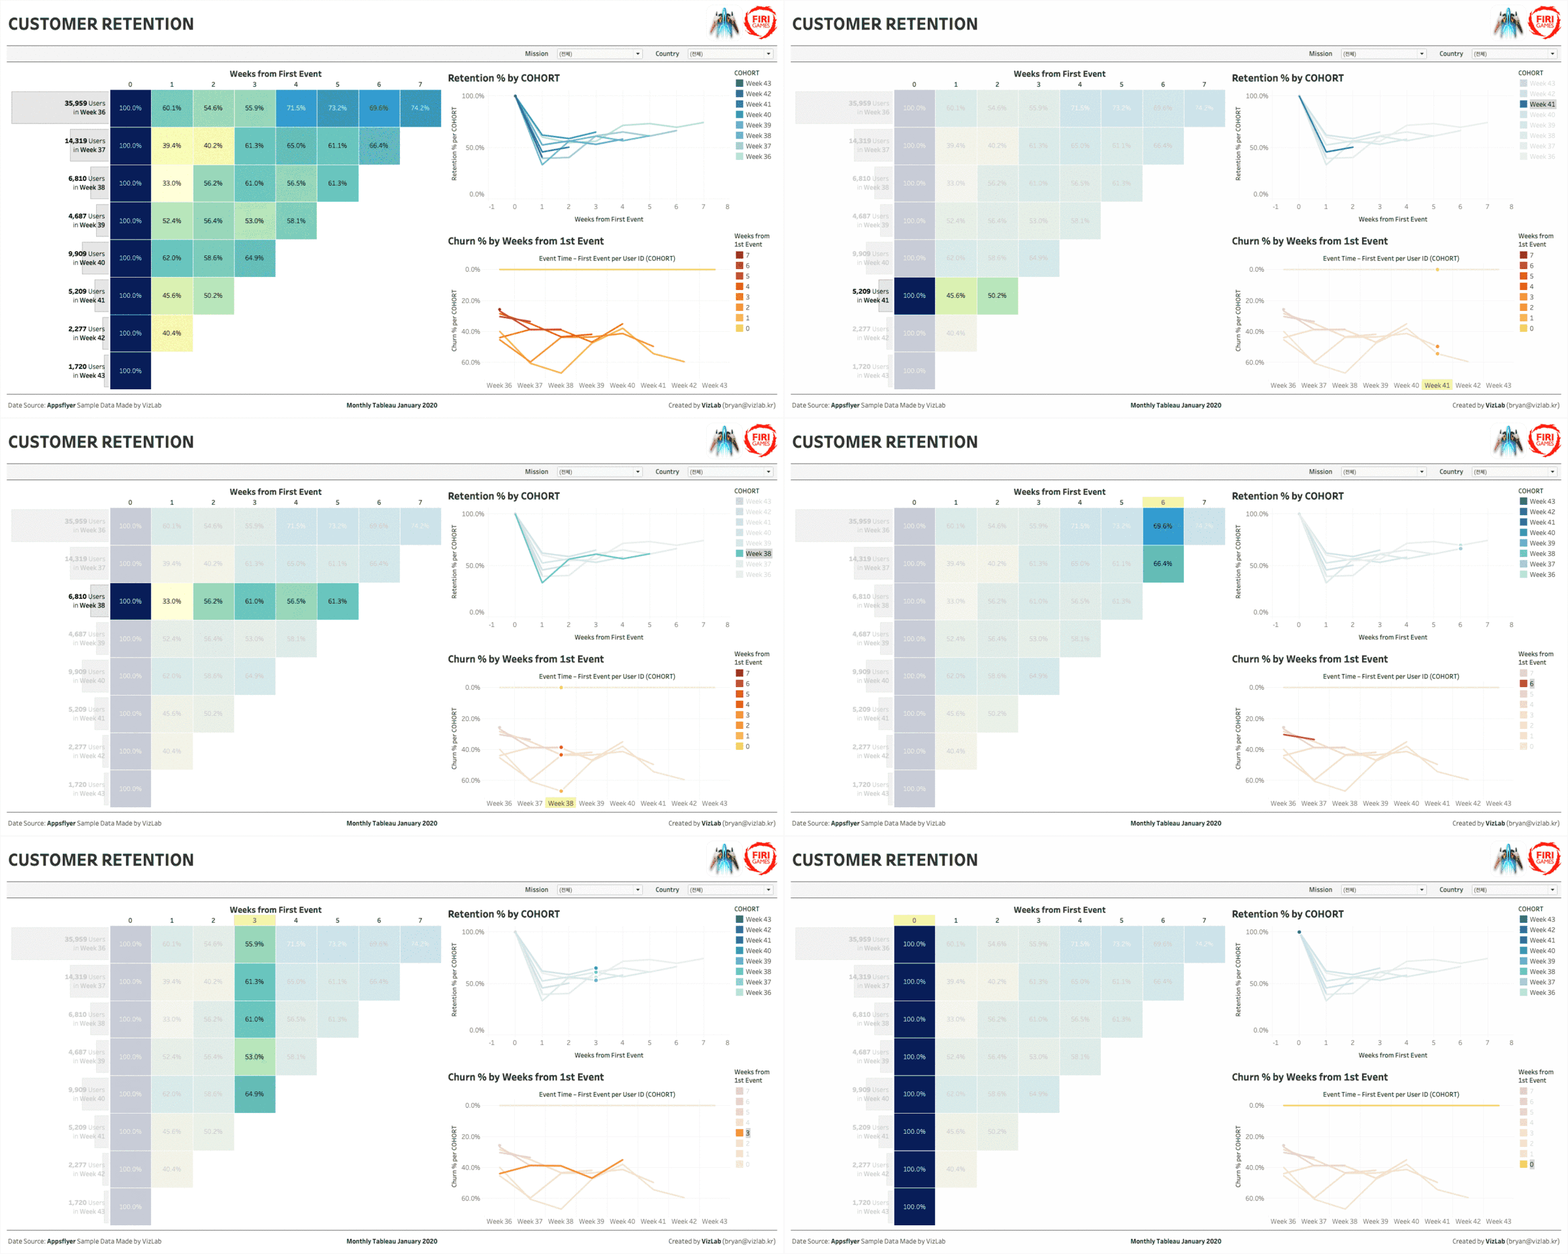
This is the dashboard image we will be creating in this seminar!

The dashboard includes four charts, and a separate chart showing the core part of the cohort chart as Churn % instead of Retention % is also included in the learning materials. One of Tableau's cool features is the ability to link multiple charts through a dashboard, and our target image demonstrates this perfectly. You can quickly, easily, and accurately read the areas you want to focus on.
The Tableau desktop version is a paid product, but it comes with a two-week free trial. You can download the Tableau desktop version here . The Tableau public version is free and can be downloaded here . The main differences between the desktop and public versions are (1) the public version cannot save workbooks created locally, and (2) the public version cannot retrieve data stored in the database. The public version is also suitable for following this course. You can download the Tableau installation guidelines here . However, the Tableau workbooks provided in the course cannot be opened in the Tableau public version. Therefore, public users must install Tableau Reader (download here ) to open the provided workbooks!
This seminar is a recording of an online seminar held live on January 13, 2020, edited and re-edited for your learning experience. Please consider this when making your purchase decision!
Q. Who would benefit from this seminar?
A. This would be helpful for those responsible for executing marketing initiatives and managing customer acquisition and retention within their company. It would also be valuable for performance marketers, CRM professionals, and others. While not directly involved in marketing, this guide will serve as a valuable starting point for anyone interested in how Tableau can be used to visualize customer acquisition and retention patterns. Furthermore, since it utilizes AppsFlyer sample data produced by VizLab, it will also serve as a valuable guide for those using the AppsFlyer platform.
Q. What functional aspects of Tableau will this seminar cover?
A. We'll explore real-world application examples of context filters, regular expressions, and more, focusing on LOD expressions. While Tableau's functional approach isn't a simple one, it's a valuable opportunity to learn how these features are used in real-world scenarios through case studies. If possible, we recommend completing the free " Welcome to Tableau World " and " Tableau Level Up " courses before attending this seminar, as this will significantly broaden your understanding.
Q. Is there anything I need to prepare before attending this seminar?
A. In the seminar introduction above, I mentioned the recent and ongoing collaboration between Tableau and AppsFlyer. It would be most effective to review this history before attending this seminar. In September 2019, we held an online seminar on utilizing AppsFlyer in Tableau, and in November, the two companies held an offline hands-on workshop together. This seminar is designed as an extension of those two previous seminars, addressing areas that were either missed or difficult to address during those sessions.
Q. Where can I download study materials?
A. The study materials for this seminar can be downloaded from Section 1, Lesson 1, Seminar Planning Video after purchasing the course. The materials consist of (1) AppsFlyer sample data, (2) a seminar guide document, and (3) a Customer Retention Monitoring sample dashboard.
Q. Please recommend the most effective way to learn from this seminar.
A. Please ask lots of questions. I, who conducted the seminar, am a Tableau specialist, and you are experts in marketing or your respective fields. I don't know your work better than you, and you don't understand Tableau as well as I do. The way we can complement each other's weaknesses is by asking and answering each other's questions about areas we don't understand, broadening our understanding. I sincerely hope this opportunity will be available. I hope the online format isn't a problem. We can exchange emails, and if we need in-depth conversations, we can consider various methods. I can prepare for these aspects and have the will to do so, so please ask lots of sharp questions. :D
Who is this course right for?
Those who are actively using Tableau for marketing work
For those who want to continuously monitor customer acquisition and retention.
For those who want to see practical examples of advanced calculations that can be created in Tableau
Need to know before starting?
Welcome to Tableau World
Tableau Level Up
10,702
Learners
297
Reviews
125
Answers
4.9
Rating
8
Courses
VizLab을 운영하고 있는 Tableau Dashboard Developer이자, Tableau Certified Instructor입니다. 한국과 유럽에 있는 회사들과 함께 BI 대시보드를 만들고, 관련된 컨설팅 서비스를 제공하고 있습니다. 또한 틈틈히 태블로 관련 콘텐츠를 제작하여 유튜브 채널에 공유하고 있습니다. 함께 공부하고 의견을 나누면서 우리 모두가 성장할 수 있는 좋은 기회가 되길 기대하고 있습니다 :D
* VizLab 이메일: bryan@vizlab.kr
* VizLab 프로필: https://www.linkedin.com/in/bryan-j-choi/
* VizLab 웹사이트: https://vizlab.tistory.com/
* VizLab 유튜브 채널: http://bit.ly/BryanVizLab
* VizLab 포트폴리오: http://bit.ly/BryanWorks
All
17 lectures ∙ (1hr 12min)
Course Materials:
1. Seminar Overview
01:34
All
15 reviews
4.6
15 reviews
$13.20
Check out other courses by the instructor!
Explore other courses in the same field!