I am Daeyoung Ryu, and I run 'DY Management Research Institute' on YouTube and Naver Blog.
Based on my professional experience and studies, I aim to provide practical assistance to those working in related fields. I offer highly hands-on approaches that can be immediately applied across various areas, including costing, management, accounting, financial business planning, investment attraction, and overall business management.
I am here to help. I provide highly practical and immediate solutions across cost accounting, management, accounting, financial business planning, investment attraction, and overall business management.
※ Areas of Expertise:
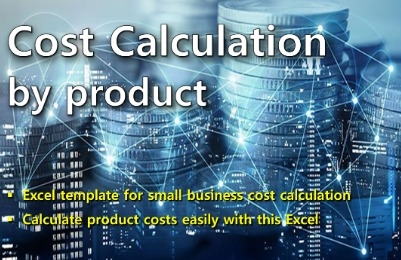
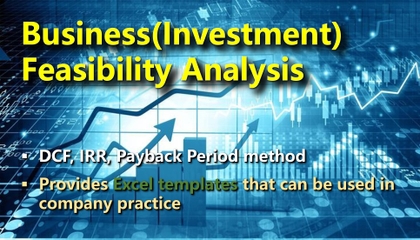
Management/cost consulting, feasibility studies, financial business planning, management simulation, and financial projections for investment attraction.
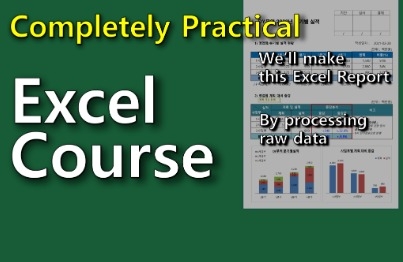
Practical Excel training, data visualization using Excel, and improving work efficiency through Excel. I will cut your working time in half.
Data visualization and business efficiency using Excel. I will cut your work time in half. I welcome requests for lectures, projects, and Q&A regarding my areas of expertise and YouTube videos.


![[Financial Investment Archive] Financial Statement Analysis EssentialsCourse Thumbnail](https://cdn.inflearn.com/public/files/courses/337641/cover/01jwg4f4r5rtfjvdt4q3e9s5mx?w=420)