

30 Minutes of SQL a Day for Beginners
alpaco
$202.40
Beginner / SQL, MySQL
5.0
(1)
SQL is an indispensable tool in data analysis. What is it and why is it important? If you are a beginner, check it out here!
Beginner
SQL, MySQL
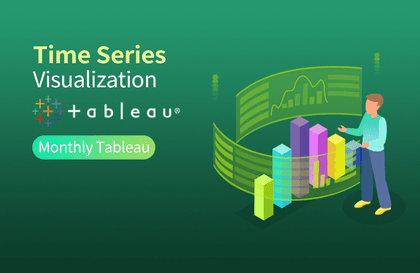
You can learn Tableau visualization skills that can be applied directly to practice from the basics.

Data formats suitable for Tableau
Data connection method and storage format
How to create a simple chart
Create complex types of charts and create hierarchies, groups, and quick table calculations.
Understanding geographic information visualization
Filters and Mark Cards
Dual axis chart
Understanding Aggregation
Continuous charts vs. discrete charts
How to create a chart using sets
How to create a dashboard
How to create a chart using calculated fields
How to create a chart using parameters
The era of self-BI,
Start visualizing your data with Tableau 🏃

Data visualization, which allows you to organize massive amounts of data into a single report, has become an essential step for efficient work processes.

If you want to learn everything from basics to advanced features in one place, so you can apply them immediately in your work, try Tableau! Tableau is an easy-to-use visualization tool that allows anyone to easily get started leveraging data , even without programming knowledge .

After learning the basics , you'll create charts for a variety of practical cases . Each topic's challenges will help you develop your own chart-making skills . After completing the course, you 'll be able to build that dashboard you only have in mind!

Data visualization for work
Office workers who want to utilize it

Immediately applicable to practice
Anyone who wants to learn visualization skills

Required in various situations in the field
Anyone who wants to know how to use Tableau

From the perspective of a non-data expert
Step by step from the basics!

Content organized into text
Get started right away! ( Theory > Practice )
From downloading Tableau
Up to advanced features (calculated fields, parameters) !
In practice, 'a lot', 'often', and 'usefully'
On the topic of used functions !
Lv1. Understanding Tableau and Data
Lv2. Chart Creation and Visualization
Lv3. Advanced Features
Q. What is Tableau?
Tableau is a data visualization and analysis tool. It's a common BI tool.
BI, or Business Intelligence, can be broadly divided into three stages: data collection, data organization, and data visualization.
Tableau is a tool specialized in data visualization, the final step in this process. While other tools can accomplish the same goal, Tableau's greatest strength lies in its ease of learning.
Q. Why should I learn Tableau?
We're now in the era of self-driven business intelligence (BI). We need to be able to analyze the data we need and immediately apply it to our work. From this perspective, learning Tableau, which is easy for anyone to use, will help you achieve results faster than any other tool.
Q. How can I utilize Tableau after learning it?
Tableau can be used in a wide variety of applications. First of all, it can be applied to almost any area within a company. The most obvious example is sales analysis. Among the clients I've taught to, one created a dashboard that displayed salesperson rankings based on HR performance, while another used a dashboard to manage the status of each machine in a factory.
It can also be used for personal purposes. You can create a map of Seoul's bicycle locations, a map of Starbucks locations, or just about anything else you can think of, as long as you have the data.
Who is this course right for?
Employed workers who want to use data visualization in their work
Learners who want to know how to use Tableau in situations that frequently occur at work
Beginners who want to acquire data visualization skills that can be applied directly to practice
All
10 lectures ∙ (5hr 30min)
Course Materials:
All
1 reviews
Check out other courses by the instructor!
Explore other courses in the same field!
25% off for new members
$80.00
25%
$110.00
![[DATA, ON] First Steps in Data AnalysisCourse Thumbnail](https://cdn.inflearn.com/public/courses/330035/cover/1ed22b3b-6709-4857-9139-ca5026217bf7/330035-eng.png?w=420)


![[D-PEC UP_PASS] National Technical Qualification: Management Information Visualization Ability (Written Exam)Course Thumbnail](https://cdn.inflearn.com/public/files/courses/336327/cover/01jytyqa2egrzn52a7m57fntzk?w=420)