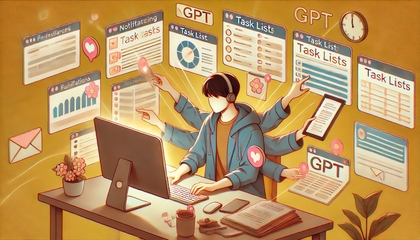
Practical Work Automation with AI Agents - An Introduction to Agentic Coding for Non-Developer Office Workers
openlab
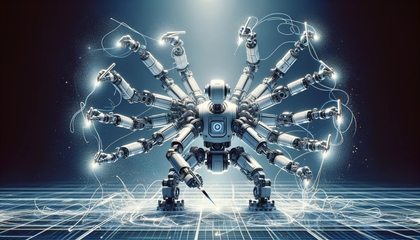
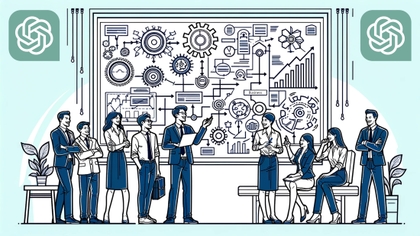
This course is not about non-developer office workers learning coding itself, but rather an education focused on developing the ability to solve business problems directly using AI agents. Previously, one had to rely on IT departments or outsourced development when problems arose, but we are now in an era where you can design alongside AI and create immediate prototypes to implement task automation. The core competencies required for this are problem definition, establishing solution strategies through AI collaboration, and the ability to build the necessary tools yourself. In particular, by utilizing Codex CLI, existing ChatGPT users can practice agentic coding immediately without additional costs, allowing non-developers to quickly gain practical experience. The curriculum is structured step-by-step, covering everything from understanding changes in the AI agent era to development basics, terminal usage, Codex CLI-based agentic coding, problem structuring, Django web app development, and the creation of actual task automation apps. Learners can secure task automation capabilities by directly building applications applicable to real-world work, such as To-Do lists, checklists, schedule management, meeting minutes, and summarization tools. The entire course is designed as a modular micro-learning system composed of short units, allowing for rapid learning of necessary content and immediate reuse during work.
Beginner
AI, Python, Django


.png?w=420)

![[D-PEC UP_PASS] National Technical Qualification: Management Information Visualization Ability (Written Exam)Course Thumbnail](https://cdn.inflearn.com/public/files/courses/336327/cover/01jytyqa2egrzn52a7m57fntzk?w=420)