Introduction to Data Visualization with Looker Studio (Google Data Studio)
This course introduces the basic concepts and practical processes of data visualization, and implements a dashboard using Looker Studio (formerly Google Data Studio). If you need a custom dashboard for your business, start learning. If you follow along step by step, you will soon gain enough know-how to create your own dashboard.
I applied without knowing anything about Lucas Studio 1, but it was very helpful. I think I need to try this and that to use it.
5.0
CHRIS HAN
67% enrolled
There are a lot of overseas materials, but there aren't many Korean language classes where you can practice directly, so I think this will be helpful. Thank you.
5.0
영원 Yeong-won
89% enrolled
I took all the classes in one day. Thank you for the great lecture. I listened well :)
What you will gain after the course
Build a solid foundation in data visualization
Learn the practical process of data visualization
Feel free to use LucasStudio features
How to create your own dashboard tailored to your business with LucasStudio
How to create a custom dashboard with GA data
How to create custom dashboards with external data sources
How to create a filter in LucasStudio
How to automatically send LucasStudio reports
The essential core know-how Here are some tips for using the newly updated Looker Studio! 💫
Introduces the basic concepts and practical processes of data visualization, This is a lecture that implements an actual dashboard using Lucas Studio .
As interest in data analysis grows, so does interest in dashboard creation. However, when I meet with people considering dashboard creation, many find the burden of development and costs overwhelming from the start. Surprisingly, many people either think of visualization as simply producing reports or have never studied the fundamentals of data visualization.
Therefore, this course combines theory and practice to help you solve both basic knowledge acquisition and dashboard creation. If you're just getting started with data visualization, learn it!
I recommend this to these people!
Data visualization from the ground up Those who want to study thoroughly
Create your own with Looker Studio Anyone who wants to create a dashboard
Efficient report writing and work Anyone who wants to create a process
Development, customization without cost burden Anyone who wants to create a dashboard
Student's worries 🥺
I want to create a dashboard unique to my business, but I don't know where to start.
Write a report in Excel and automatically Can't you update it?
Doesn't Looker Studio have less freedom? I want to do calculations and edit data.
We don't have any development staff or money to spend. It's burdensome, but can you create a dashboard?
Unique features of this course 🌱
This course covers the fundamentals of data visualization, ensuring a solid foundation from the ground up. Even beginners to visualization can easily follow along. Furthermore, the hands-on training using Ruckus Studio allows you to create dashboards without the financial or development burden. Furthermore, the training incorporates the latest updates, allowing you to quickly grasp the menus and features.
Data Visualization Foundations: Before delving into the tools themselves, we'll cover the fundamentals required for data visualization. Therefore, even those new to visualization (or creating their first dashboard) can easily follow along.
Create a dashboard by following along: Rather than simply explaining the functions, this course will teach you how to create a practical report (dashboard) by following along. This means you can learn how to create a dashboard simply by following along, without having to research or memorize the features.
Case-Based Lectures: We've created practical reports with practical examples that can be used in real-world situations, so you can immediately apply them to your business by simply changing the data source.
Reflecting the latest updates: Since we are conducting the training with the recently updated LucasStudio, you can quickly learn the features and expressions that have changed with the update from Google Data Studio to LucasStudio.
What you'll learn 📚
1.Basic concepts of data visualization
We'll look at the basic concepts of what data visualization is and why it's necessary, and explain in detail the key terms used in practice.
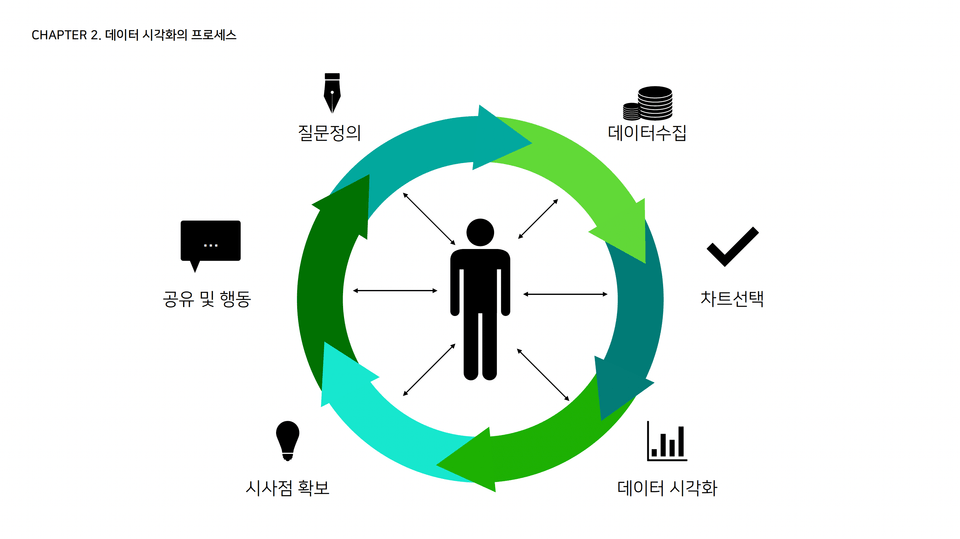
2.Data Visualization Practical Process
This article explains the practical process step by step to visualize data.
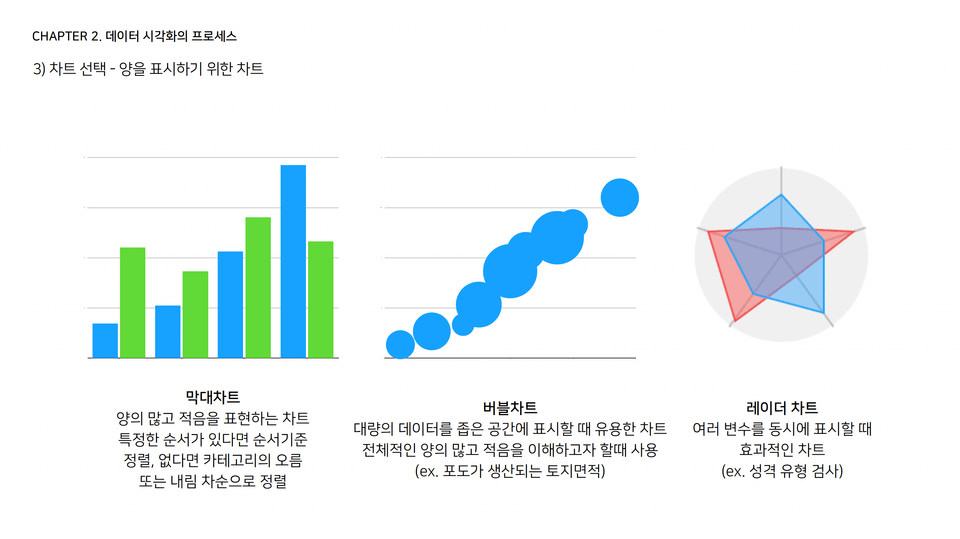
3.Types and features of charts that can be used for visualization
Beyond line, bar, and pie charts, we introduce a variety of chart types that can effectively convey information. Learn how to create charts that best suit your data characteristics.
4.Practice with the latest updated version
We'll be conducting hands-on training with the recently updated Looker Studio in Google Data Studio (as of November 2022). This means you'll quickly learn the updated features and expressions.
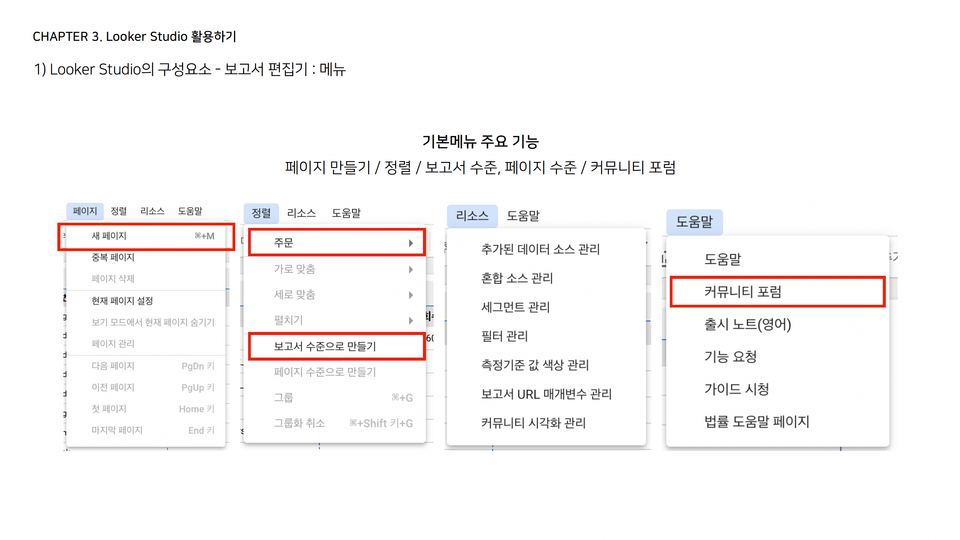
5.Introduction to LucasStudio's Key Features
We will cover in detail the new features and changed expressions introduced with the update to LucasStudio so that you can immediately apply them in practice.
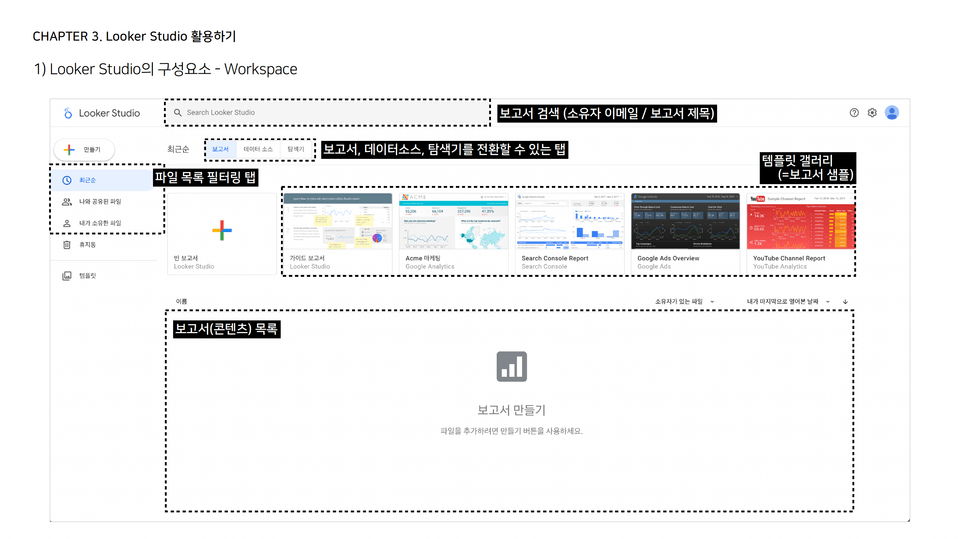
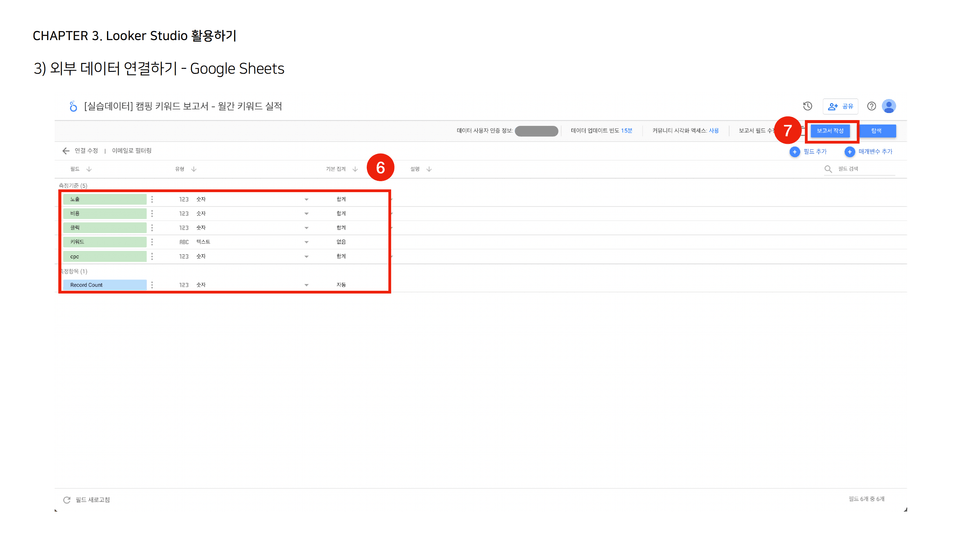
6.Practice connecting external data
This hands-on tutorial will teach you how to create a dashboard in Looker Studio by connecting external data as well as GA data.
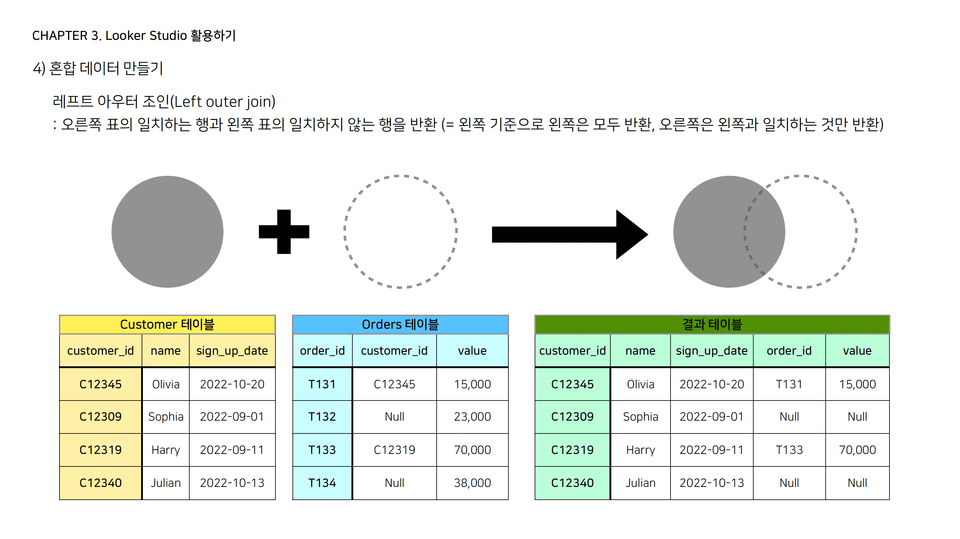
7.Creating mixed data
This article explains the criteria and methods for creating recently updated blended data. This will enable you to create dashboards using more advanced data sources.
8.Practice creating a sample report (dashboard)
Let's share and create a report (dashboard) template we use in practice. By applying the template, you can create a dashboard unique to your business.
Expected Questions Q&A 💬
Q. I've never done data visualization before. Can I still take this course?
Yes, you can. This course covers basic terminology, making it suitable for even those new to data visualization, so feel free to jump in. After the basic theory lecture, you'll also have the opportunity to create your own report (dashboard) using LucasStudio, which will make it easier to understand. I believe you'll learn even faster if you follow the sample report after the lecture.
Q. Can I create a dashboard right away after taking this course?
Yes, this course covers not only basic theory but also hands-on practice in creating reports (dashboards). Simply change the data source and you're ready to apply it to your business. After changing the source, you can customize it to fit your business needs and create your own custom dashboard.
Q. I'm already using LucasStudio (formerly DataStudio). Can I still take this course?
If you're already familiar with LucasStudio and have experience creating reports (dashboards), this may not be suitable. I recommend it to anyone looking to brush up on the fundamentals or considering process improvements for efficiency.
Q. Is there anything I need to prepare before attending the lecture?
It's helpful to first prepare a Google Analytics account to link. (The course utilizes sample data and a Google demo account, so even without data, you can still follow the lecture.) Also, a middle school-level understanding of statistics and charts will make it easier to understand.
Introducing the Knowledge Sharer ✒️
Noh Ji-hye
Former open source marketing consultant
Former PM of Blank Corporation's New Business Team
Shinhan S Bridge Seoul Incubation Digital Marketing Consulting
Mobi Academy - Google Tag Manager Course for Marketers
Fast Campus - Digital Marketing Super Gap Package (Google Tag Manager) Course
Seoul Business Agency DT School - GTM, MBTI Creation, and Data Visualization Lectures
As a digital marketing consultant, I've noticed that many people struggle with data visualization and dashboard creation. In particular, many find the development and cost burden prohibitive.
So, to show you how to create dashboards without the burden of development and costs, I've created this course using the free visualization tool, Rooker Studio. Get started without any pressure. The course is structured so you can create reports just by following along, making it easy to master.
If you're new to data visualization, be sure to also take the practical process theory lectures in the first section. Studying together will create even greater synergy. I recommend this course not only to beginners but also to anyone looking to build a solid foundation for effective visualization.
Notes before taking the course ✔️
We provide an 80-page PDF file and six sample reports ready for immediate use in your practice. Use the sample reports to create your own reports (dashboards). Document formats other than the sample reports are not provided separately within the course materials.
Lecture materials can be downloaded by clicking the [Lecture Materials] button in the first lecture video.
For a sample report , please refer to the link on pages 78-83 of the lecture materials PDF file.
Recommended for these people
Who is this course right for?
For those who are new to data visualization
For those who want to study data visualization from the basics
For those of you who are new to Looker Studios
For those who want to discover the hidden features of Lucas Studio
For those who want to use the control function of Lucas Studio
For those of you who are tired of creating reports in Excel
For those interested in implementing a dashboard that updates in real time
For those who want to streamline their report writing process
There are a lot of overseas materials, but there aren't many Korean language classes where you can practice directly, so I think this will be helpful. Thank you.